Fig. 1
Download original image
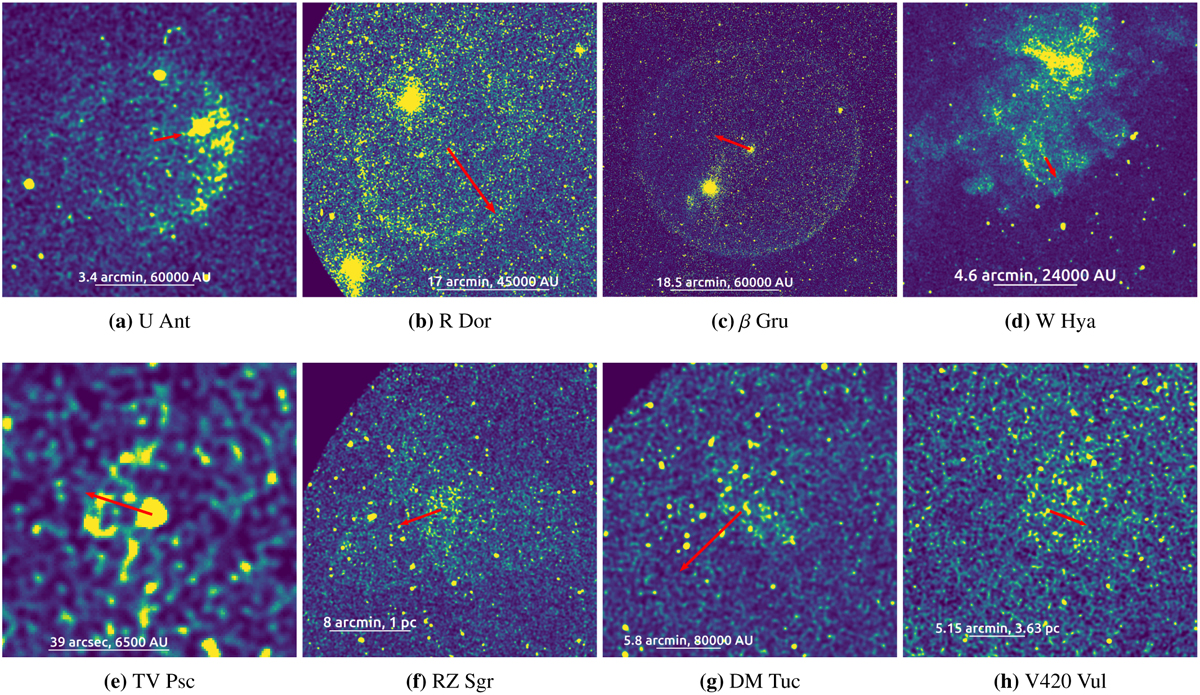
GALEX catalogue FUV images of the stars and their surroundings. North is up and east to the left; the same orientation is used for all the images. The arrows (originating at the location of each star) represent the projected distance the stars would travel over a timescale of 5000 yr, with the exception of TV Psc (where the distance corresponds to 500 yr), RZ Sgr (40 000 yr), and V420 Vul (20 000 yr). The space motion vector indicates the velocity relative to the local standard of rest (LSR; Schönrich et al. 2010) and is derived from proper motion and radial velocity data using the Astropy coordinates package. The large bright spots seen in the images for β Gru, R Dor, and U Ant come from objects along the line of sight, either background stars or galaxies.
Current usage metrics show cumulative count of Article Views (full-text article views including HTML views, PDF and ePub downloads, according to the available data) and Abstracts Views on Vision4Press platform.
Data correspond to usage on the plateform after 2015. The current usage metrics is available 48-96 hours after online publication and is updated daily on week days.
Initial download of the metrics may take a while.