Fig. 4
Download original image
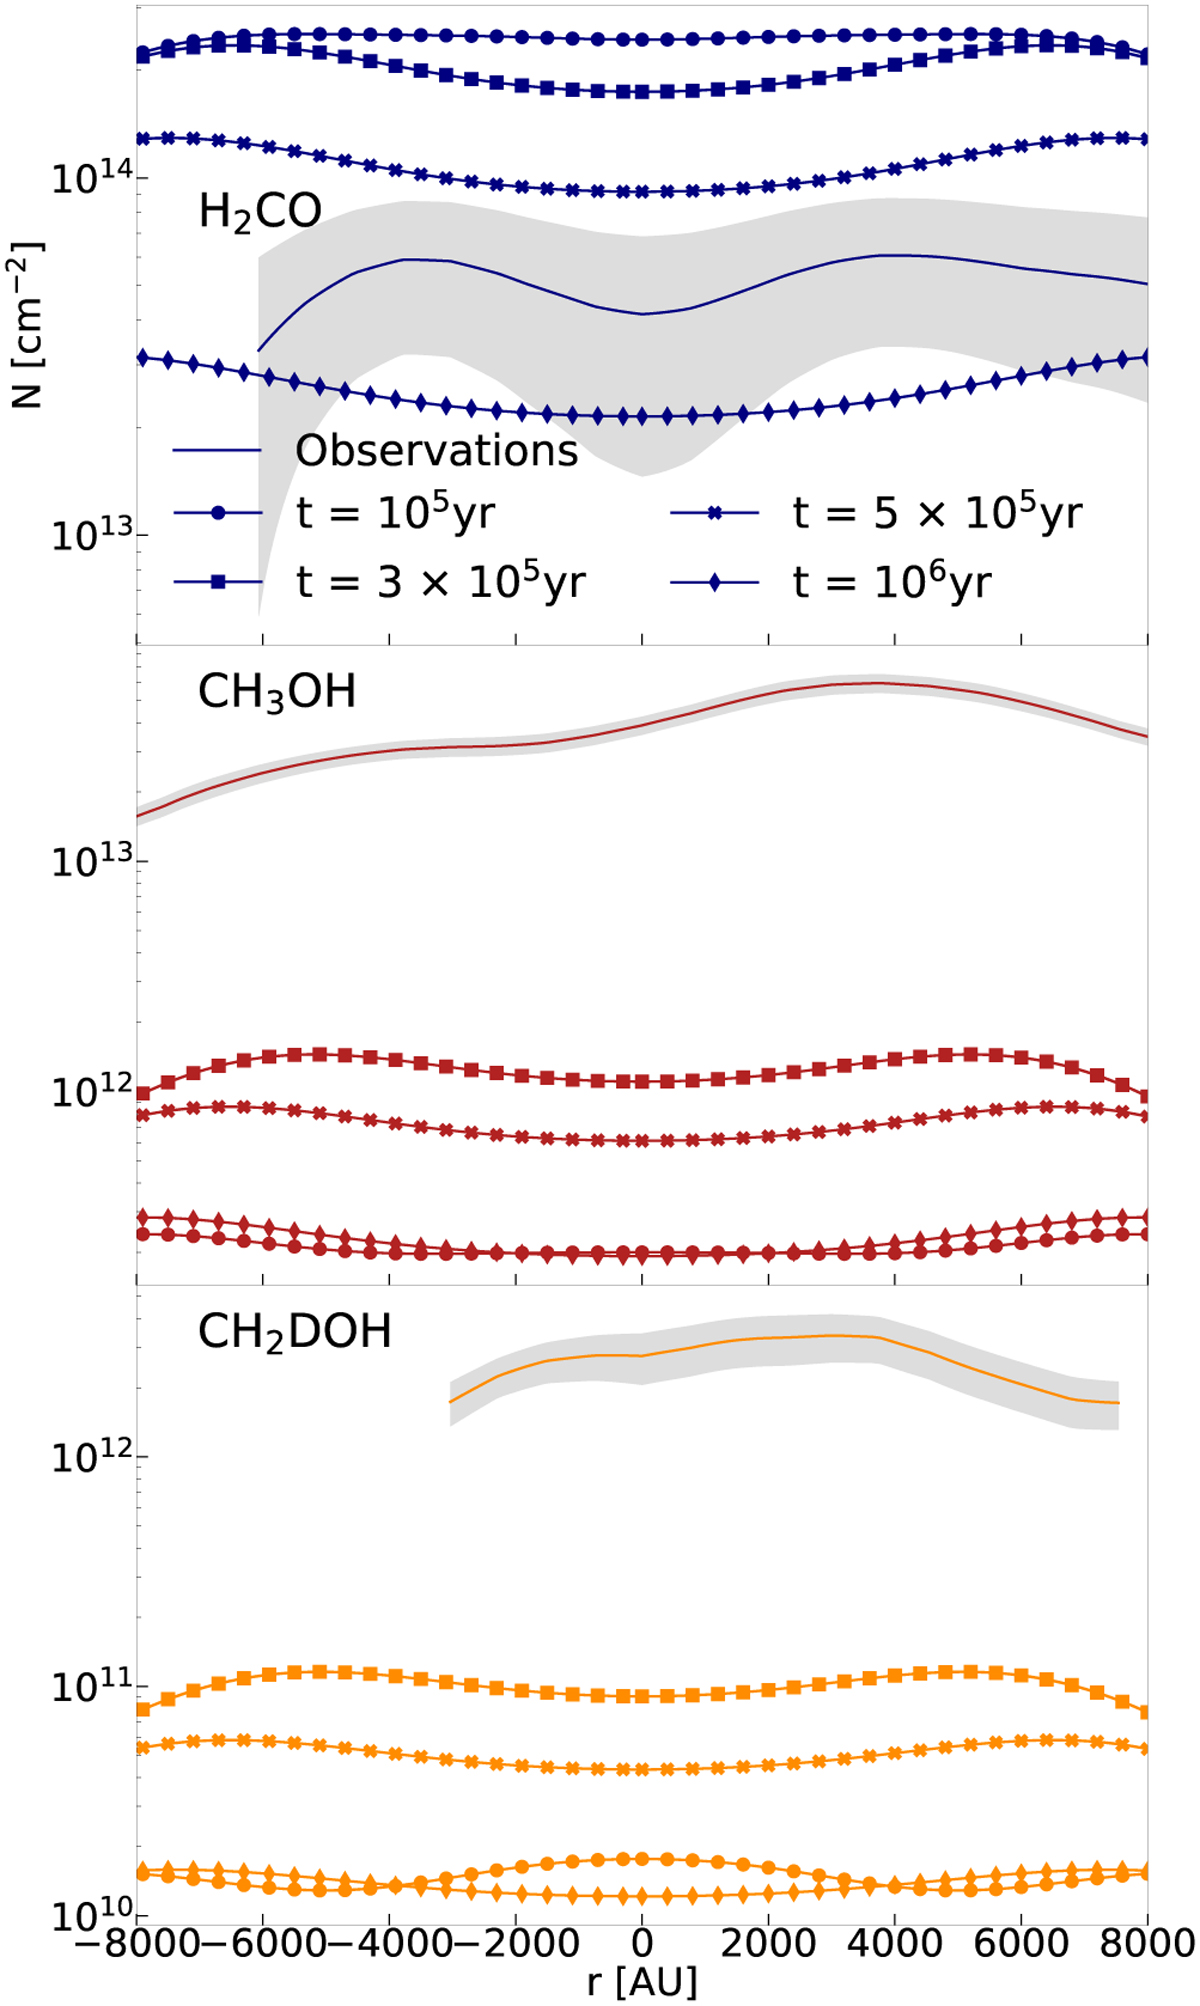
Column density profiles of H2CO, CH3OH, and CH2DOH for the 1D-4 model for four different time steps ranging from 105 yr to 106 yr. The lines with markers show the modelled results, integrated along the line of sight and convolved with a 30″ beam. The solid lines show the observationally obtained column density profiles obtained by Chacón-Tanarro et al. (2019) by taking a cut through the dust and methanol peaks. The grey-shaded areas indicate the error bars of the column densities. The position of the dust peak is at r = 0 AU, while r > 0 AU is the direction towards the methanol peak.
Current usage metrics show cumulative count of Article Views (full-text article views including HTML views, PDF and ePub downloads, according to the available data) and Abstracts Views on Vision4Press platform.
Data correspond to usage on the plateform after 2015. The current usage metrics is available 48-96 hours after online publication and is updated daily on week days.
Initial download of the metrics may take a while.