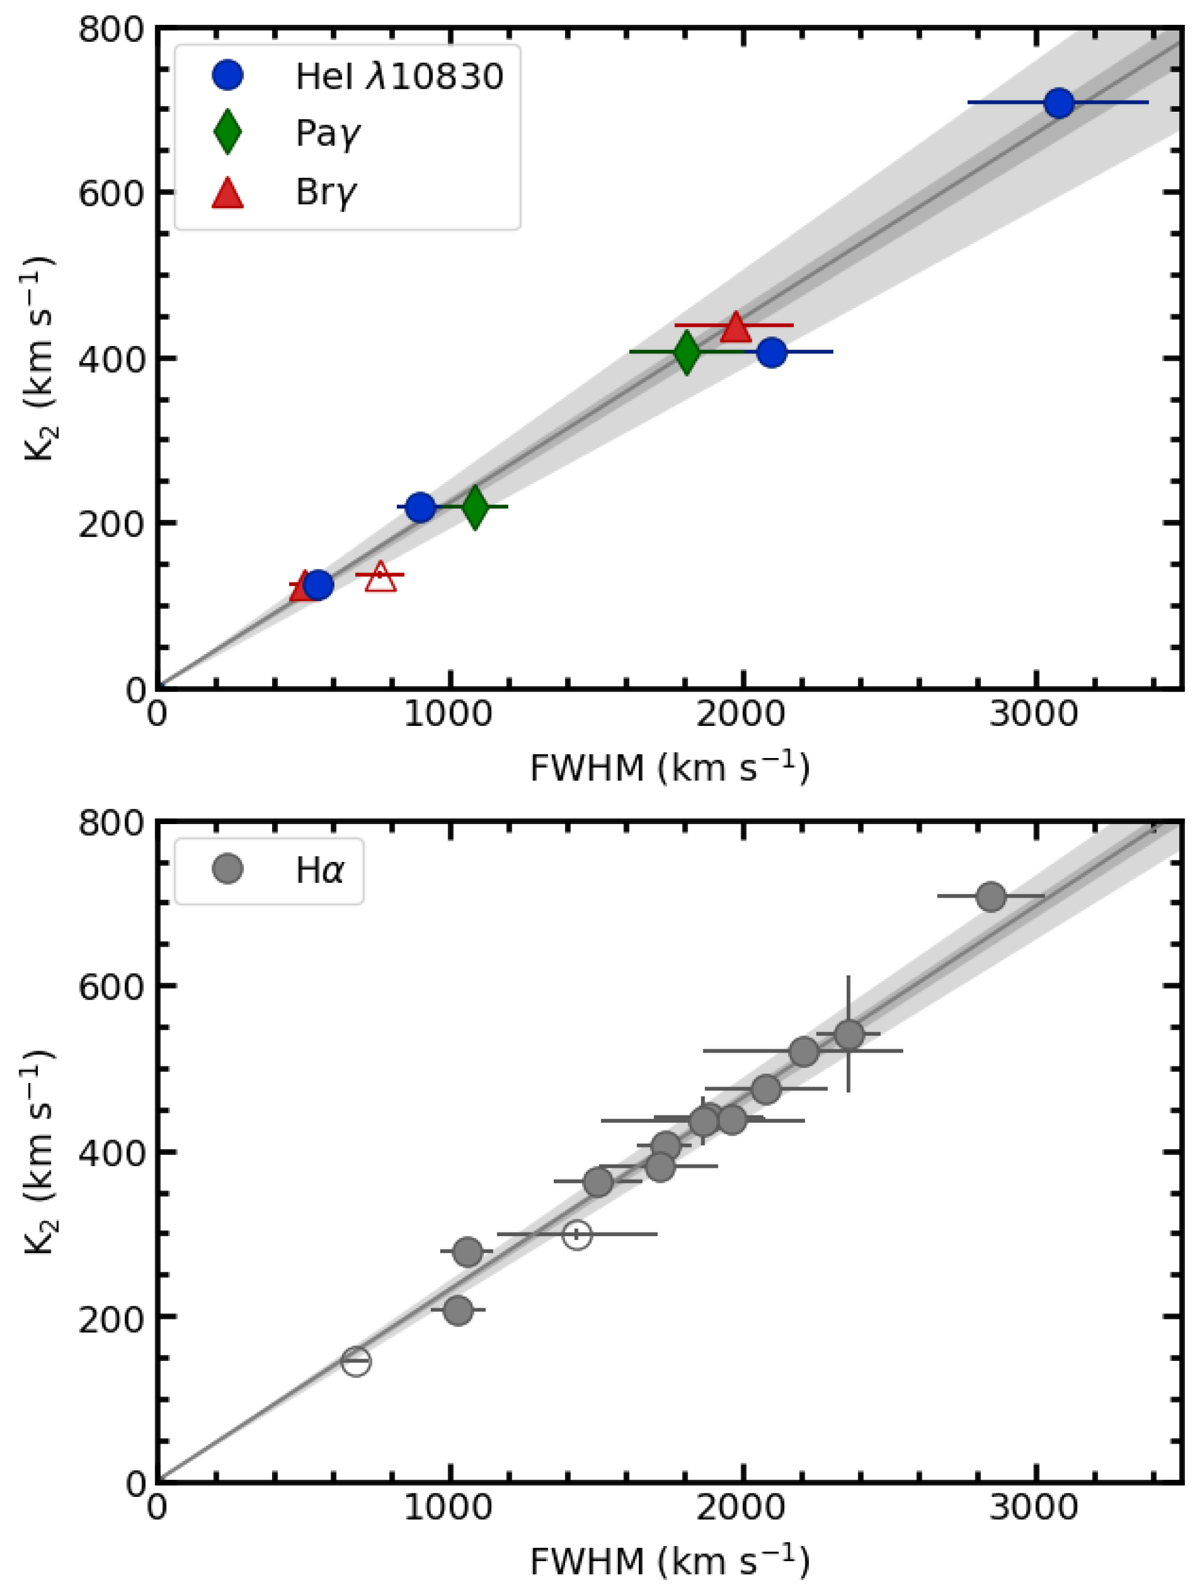
Fig. 2.
Download original image
FWHM–K2 correlation for SXTs with the best linear fit, using NIR (top panel) and optical (bottom panel; data come from Casares 2015) emission lines. Filled symbols indicate BH binaries, while NS binaries are denoted with open symbols. The shaded regions in both plots correspond to the 1σ uncertainty of the linear fit (dark grey) and the total uncertainty of the correlation that includes the result from the Monte Carlo simulation in Sect. 3 (light grey).
Current usage metrics show cumulative count of Article Views (full-text article views including HTML views, PDF and ePub downloads, according to the available data) and Abstracts Views on Vision4Press platform.
Data correspond to usage on the plateform after 2015. The current usage metrics is available 48-96 hours after online publication and is updated daily on week days.
Initial download of the metrics may take a while.