Open Access
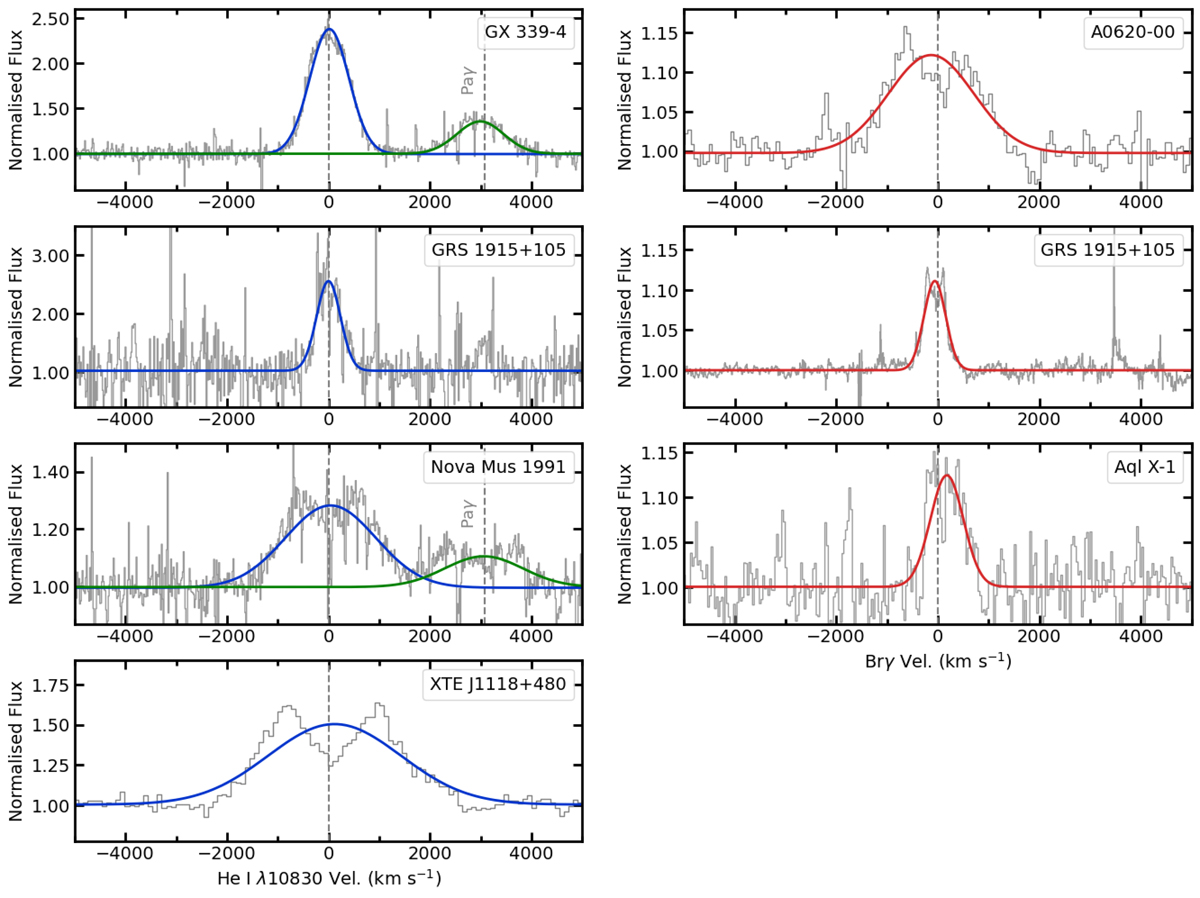
Fig. 1.
Download original image
Gaussian fits to the NIR emission line profiles. The left column shows the fits for the He Iλ10830 (blue) and Paγ (green; when the S/N allowed to fit the line) emission lines, while the fits to Brγ (red) are shown in the right column.
Current usage metrics show cumulative count of Article Views (full-text article views including HTML views, PDF and ePub downloads, according to the available data) and Abstracts Views on Vision4Press platform.
Data correspond to usage on the plateform after 2015. The current usage metrics is available 48-96 hours after online publication and is updated daily on week days.
Initial download of the metrics may take a while.