Fig. 5
Download original image
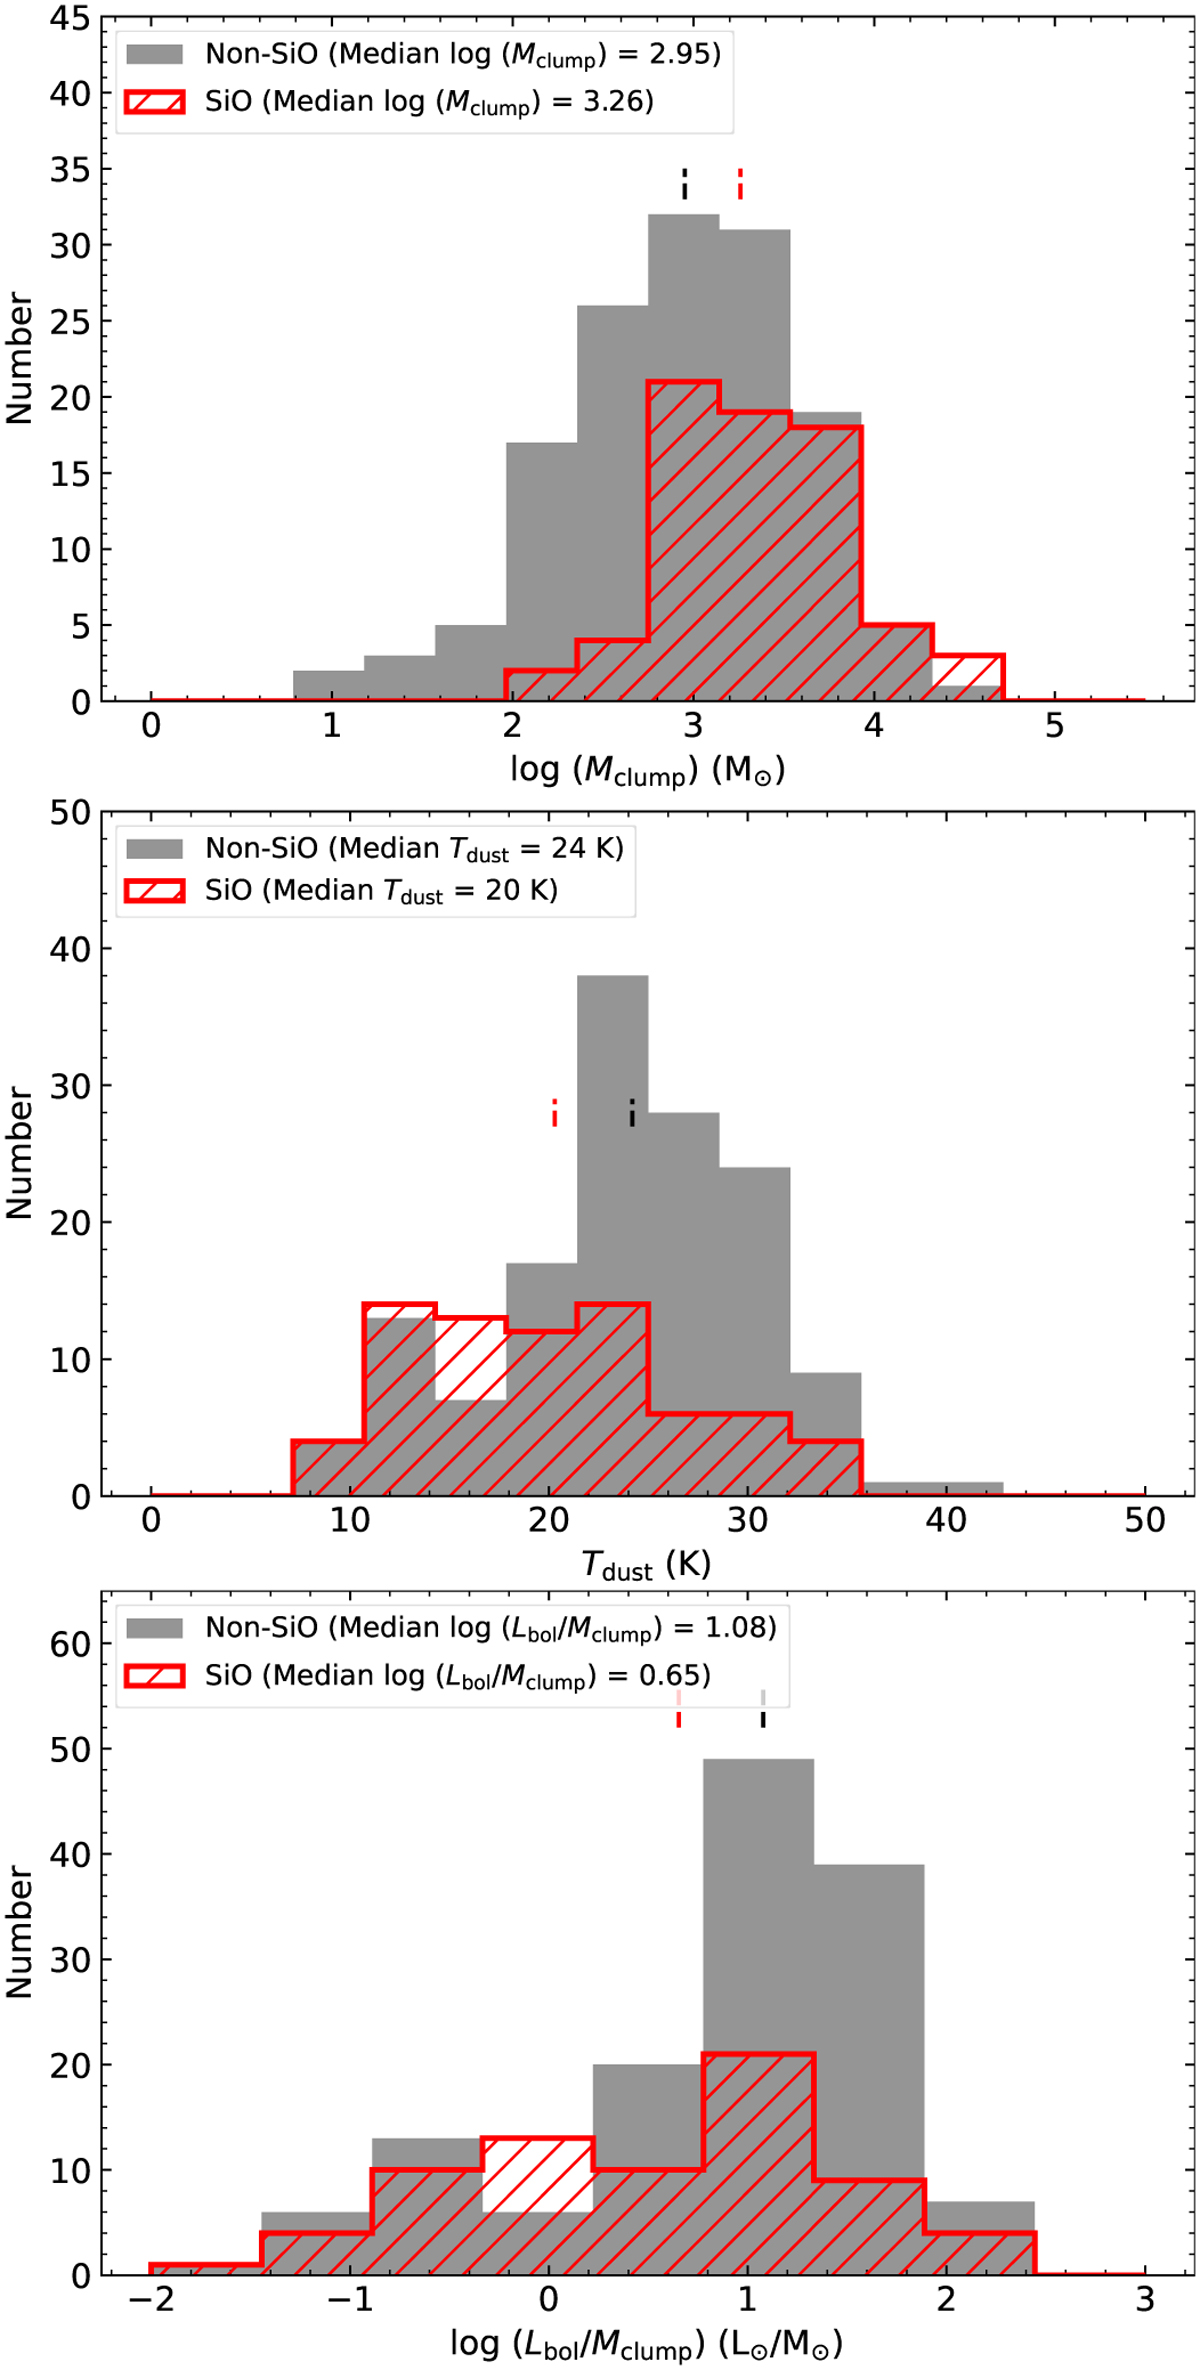
Histograms of dust clump mass (top panel), dust temperature (middle panel), and bolometric luminosity over dust clump mass (bottom panel) for sources with SiO detection (red) and non-detection (gray). The black and red vertical dashed lines correspond to the median values of the respective physical properties for SiO detected and non-SiO detected sources, respectively.
Current usage metrics show cumulative count of Article Views (full-text article views including HTML views, PDF and ePub downloads, according to the available data) and Abstracts Views on Vision4Press platform.
Data correspond to usage on the plateform after 2015. The current usage metrics is available 48-96 hours after online publication and is updated daily on week days.
Initial download of the metrics may take a while.