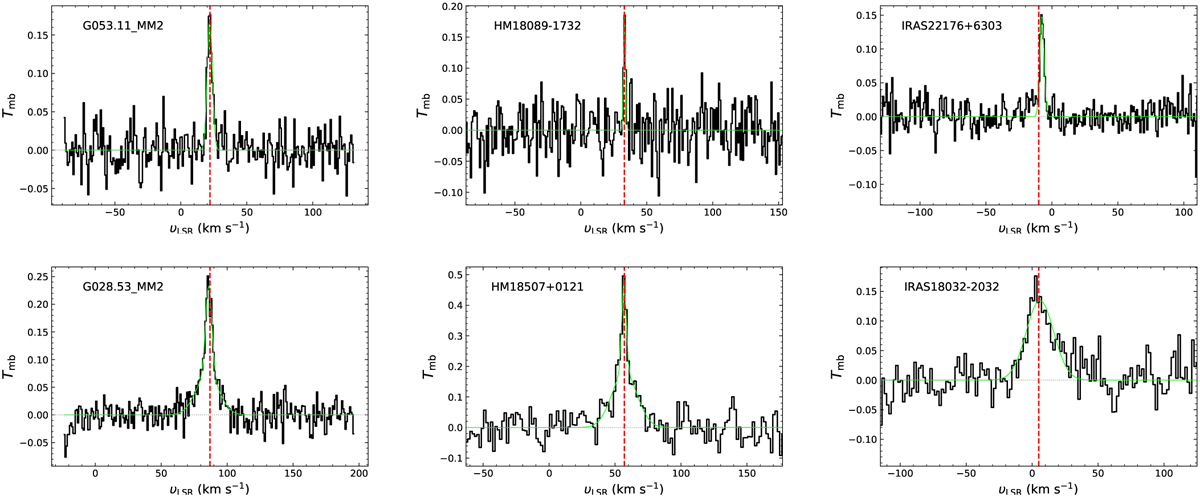
Fig. 2
Download original image
43 GHz SiO J = 1–0 spectra in Tmb scale toward two IRDCs (G053.11+00.05 MM2 and G28.53−00.25 MM2) in the left panel, two HMPOs (HM18089−1732 and HM18507+0121) in the middle panel, two UCHIIs (IRAS22176+6303 and IRAS18032−2032) in the right panel. The SiO spectral plots for all other detected sources are presented in Fig. A.1. The vertical green dotted lines indicate a systemic velocity of individual sources. The purple curves are Gaussian profile fits to SiO emission.
Current usage metrics show cumulative count of Article Views (full-text article views including HTML views, PDF and ePub downloads, according to the available data) and Abstracts Views on Vision4Press platform.
Data correspond to usage on the plateform after 2015. The current usage metrics is available 48-96 hours after online publication and is updated daily on week days.
Initial download of the metrics may take a while.