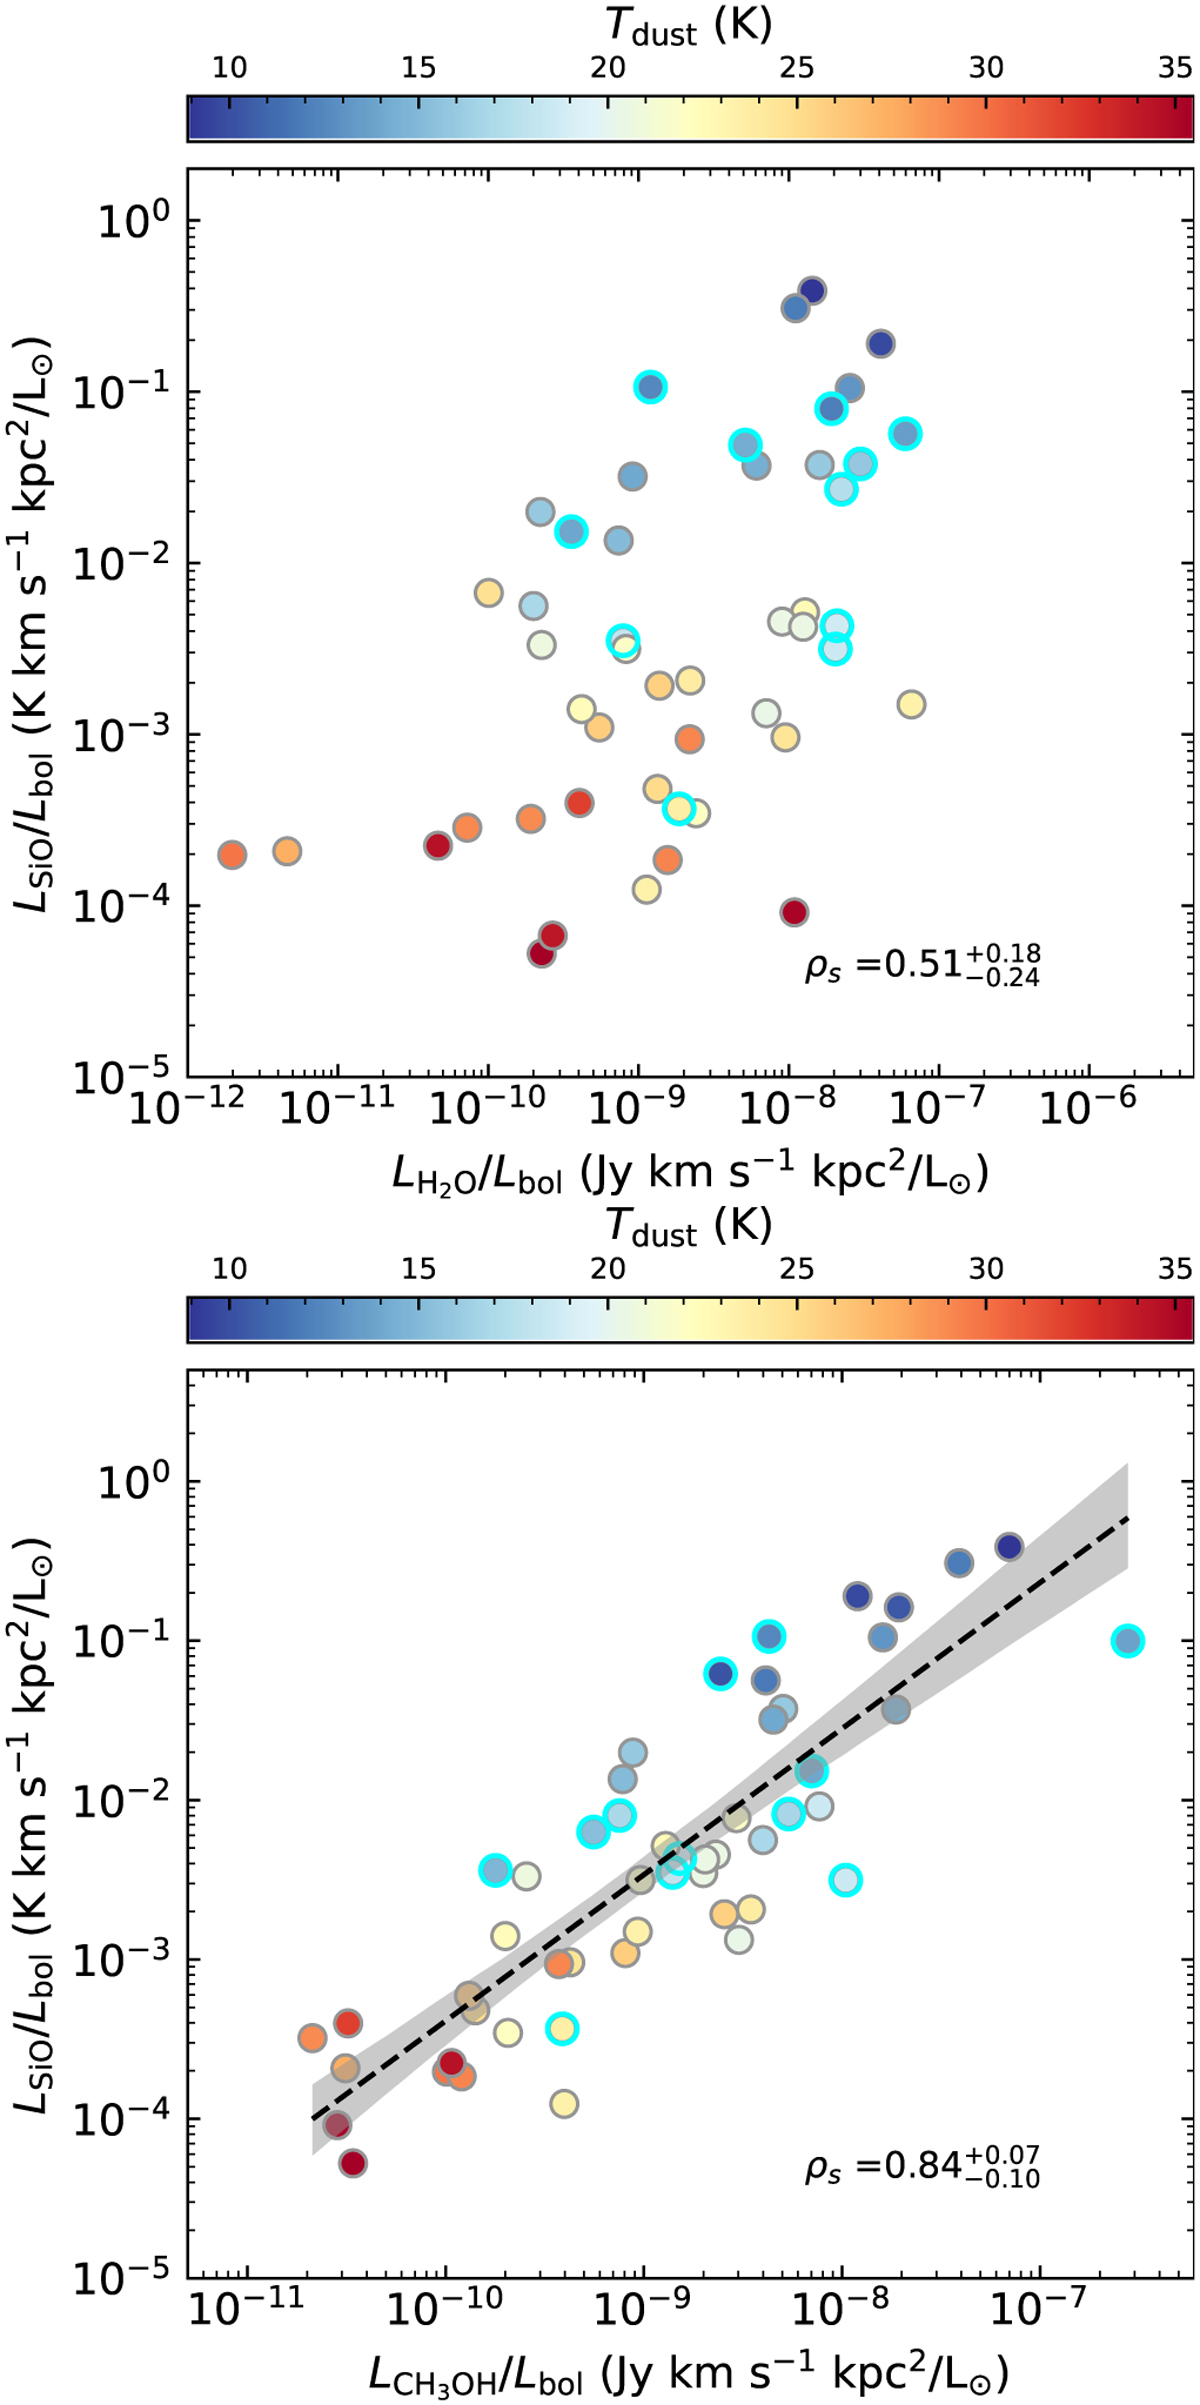
Fig. 11
Download original image
LSio/Lbol versus ratios of 22 GHz H2O (upper) maser and Class I CH3OH maser luminosities (lower) and Lbol toward sources with both detections of SiO and masers. The colors indicate dust temperatures. The black dashed lines and gray shade regions are the best-fit and the 95% confidence intervals of fitting. The cyan open circles indicate sources considered to show no significant sign of SiO wings.
Current usage metrics show cumulative count of Article Views (full-text article views including HTML views, PDF and ePub downloads, according to the available data) and Abstracts Views on Vision4Press platform.
Data correspond to usage on the plateform after 2015. The current usage metrics is available 48-96 hours after online publication and is updated daily on week days.
Initial download of the metrics may take a while.