Fig. 10

Download original image
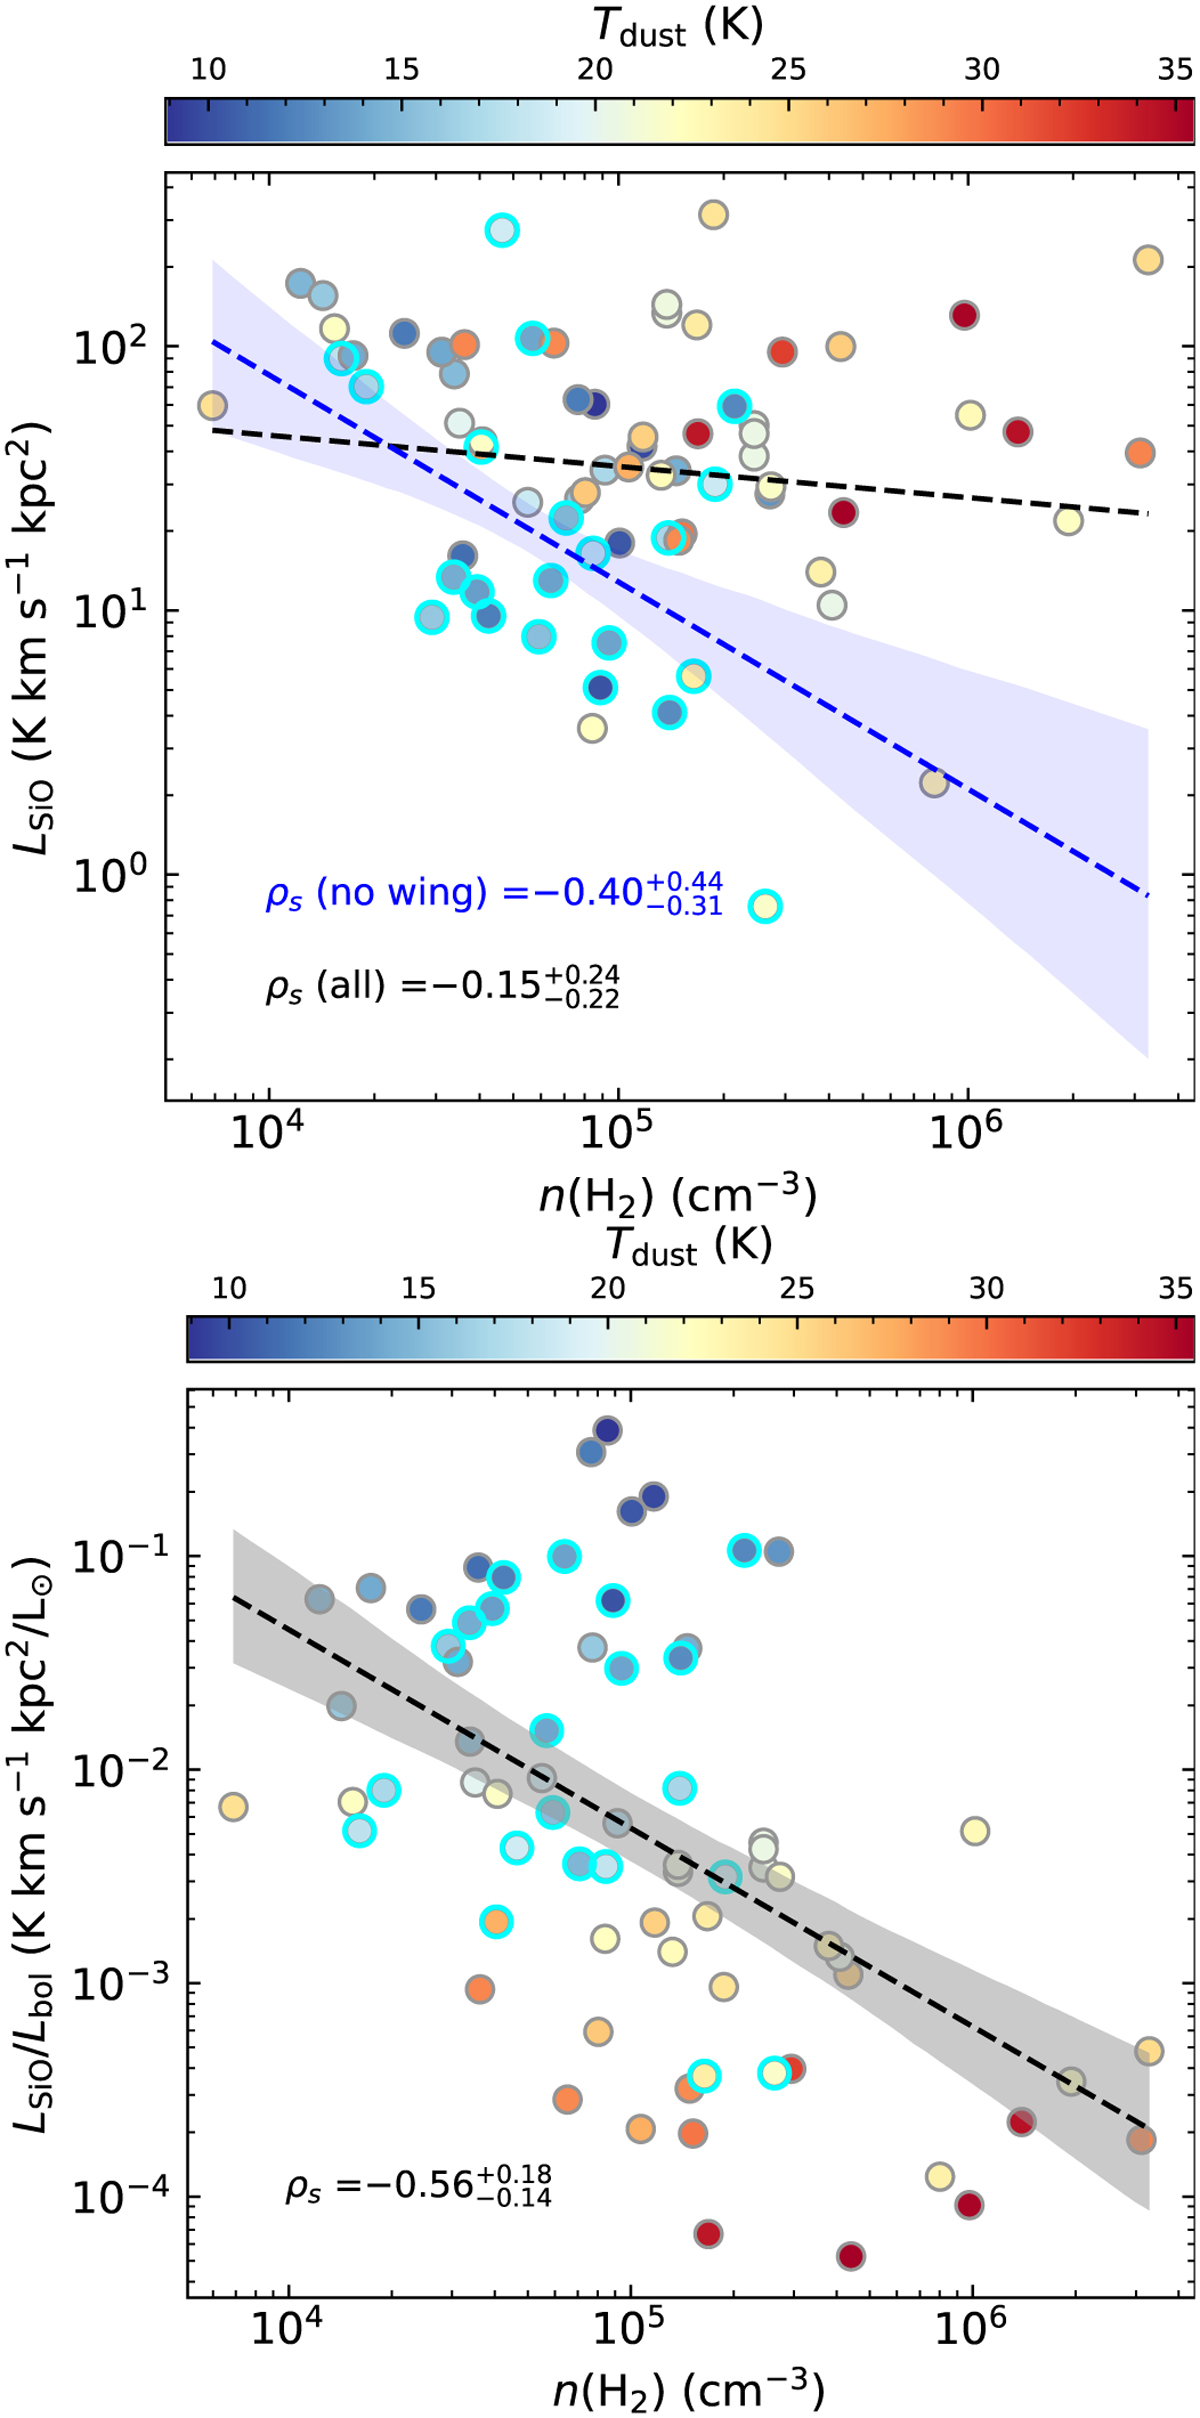
Upper: comparison of LSio and n(H2) toward sources having n(H2) parameter available. Lower: comparison of LSio/Lbol and n(H2) toward sources having n(H2) and Lbol parameters. The color bars for both the panels present dust temperature. The black and blue dashed lines in the upper panel are the best fits to data points with SiO wings or without. The blue shaded region presents 2σ confidence intervals for the best fit for non-Sio wing sources indicated by open cyan circles. The markers are same as for Figs. 7 and 8.
Current usage metrics show cumulative count of Article Views (full-text article views including HTML views, PDF and ePub downloads, according to the available data) and Abstracts Views on Vision4Press platform.
Data correspond to usage on the plateform after 2015. The current usage metrics is available 48-96 hours after online publication and is updated daily on week days.
Initial download of the metrics may take a while.


