Open Access
Fig. 6.
Download original image
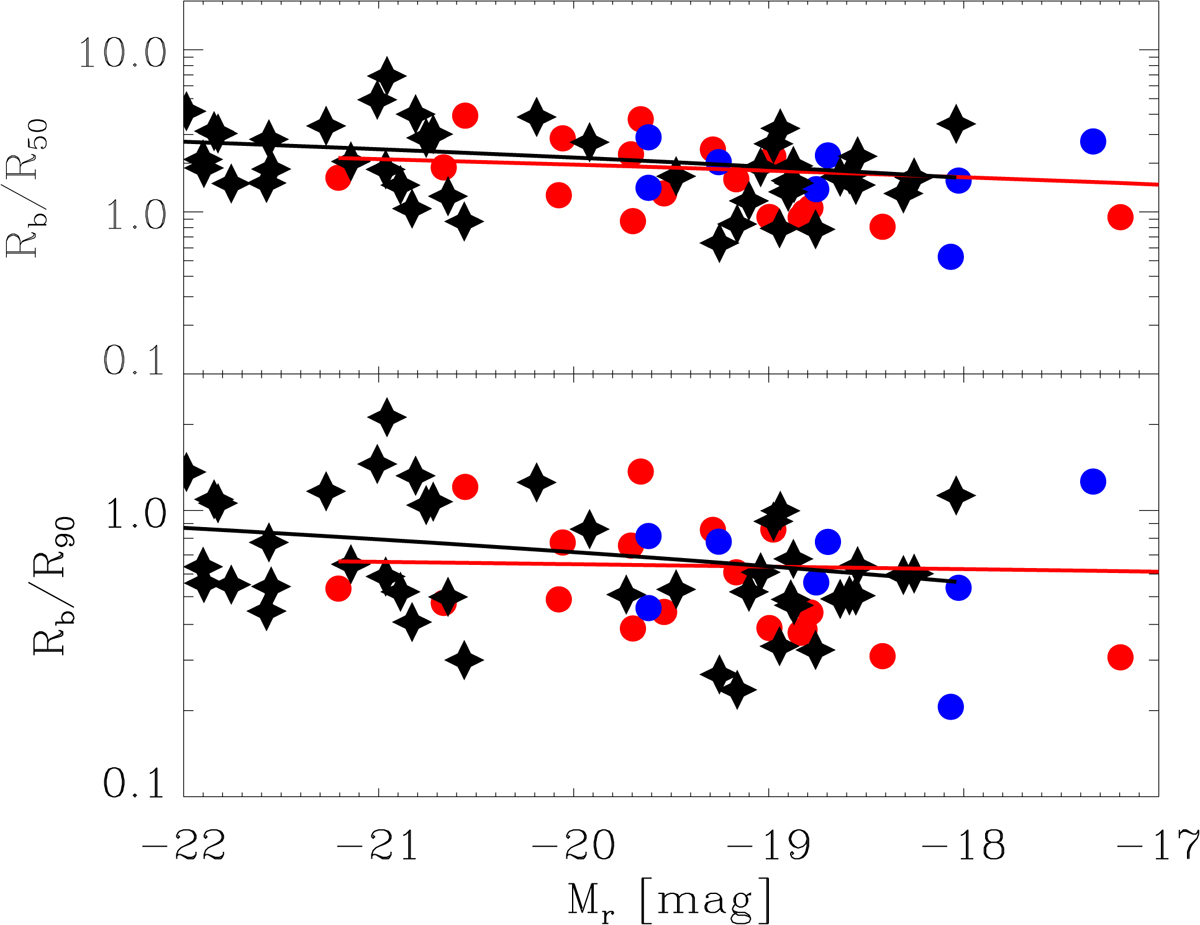
Bar radius scaled by R50 (top panel) and R90 (bottom panel) for the galaxies in the Virgo cluster (blue and red points) and in the field (black stars). The full black and red lines represent linear fits to Virgo cluster and in the field, respectively.
Current usage metrics show cumulative count of Article Views (full-text article views including HTML views, PDF and ePub downloads, according to the available data) and Abstracts Views on Vision4Press platform.
Data correspond to usage on the plateform after 2015. The current usage metrics is available 48-96 hours after online publication and is updated daily on week days.
Initial download of the metrics may take a while.