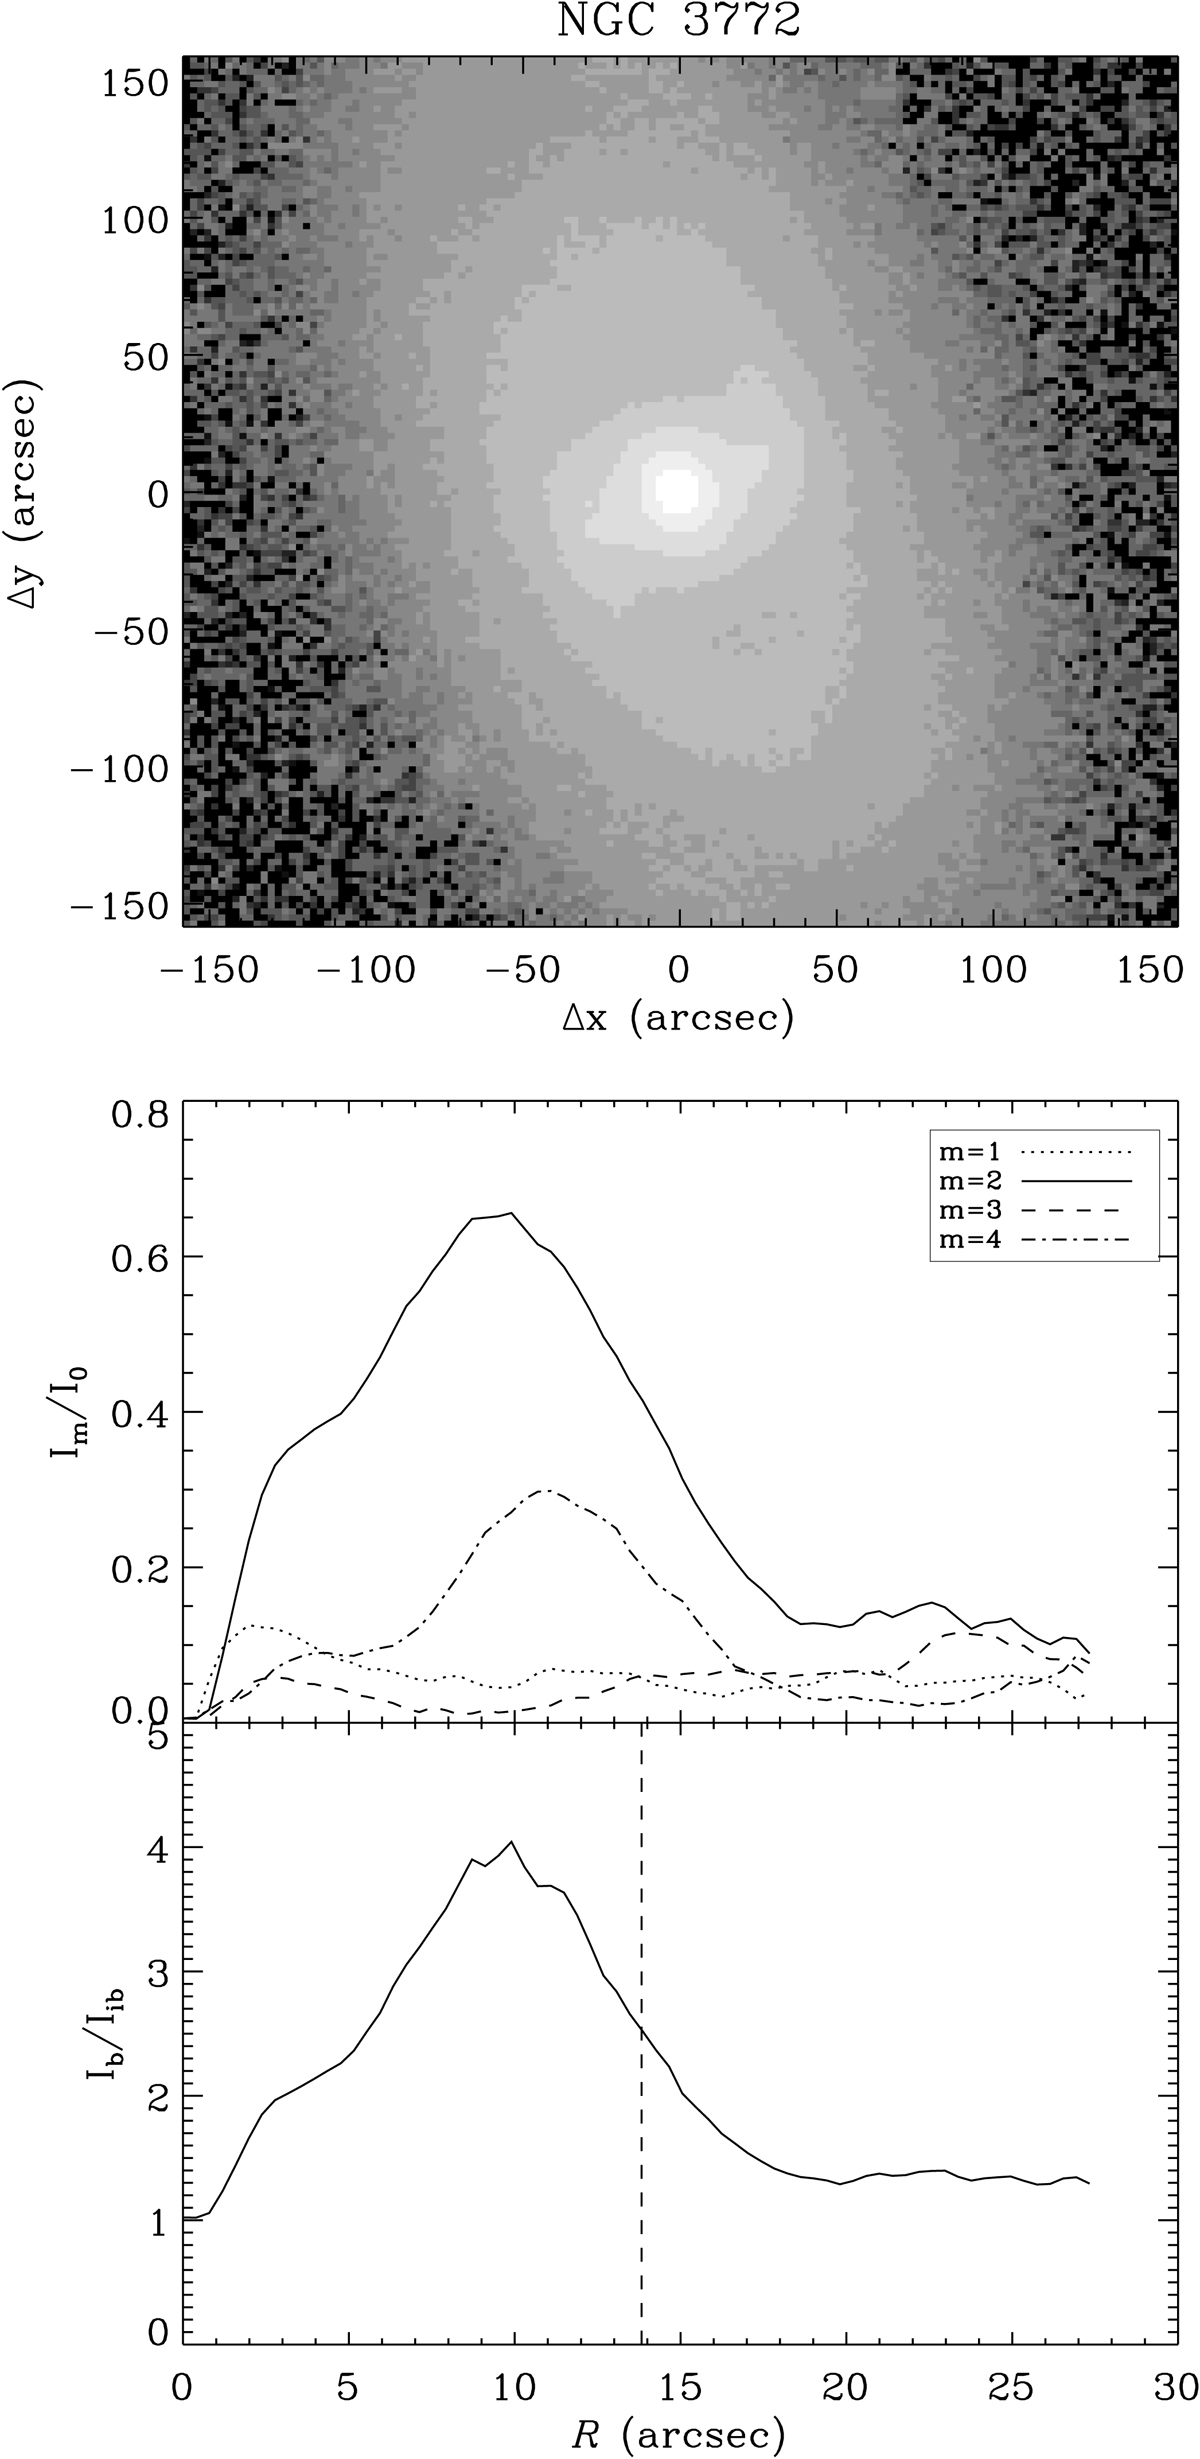
Fig. 3.
Download original image
Fourier analysis for NGC 3772, taken as an example. From top to bottom: non-deprojected SDSS r-band image of the galaxy, radial profiles of the relative amplitude of the m = 1, 2, 3, and 4 Fourier components, radial profiles of the bar/interbar intensity ratio used to derive the bar radius, marked by the vertical dashed line.
Current usage metrics show cumulative count of Article Views (full-text article views including HTML views, PDF and ePub downloads, according to the available data) and Abstracts Views on Vision4Press platform.
Data correspond to usage on the plateform after 2015. The current usage metrics is available 48-96 hours after online publication and is updated daily on week days.
Initial download of the metrics may take a while.