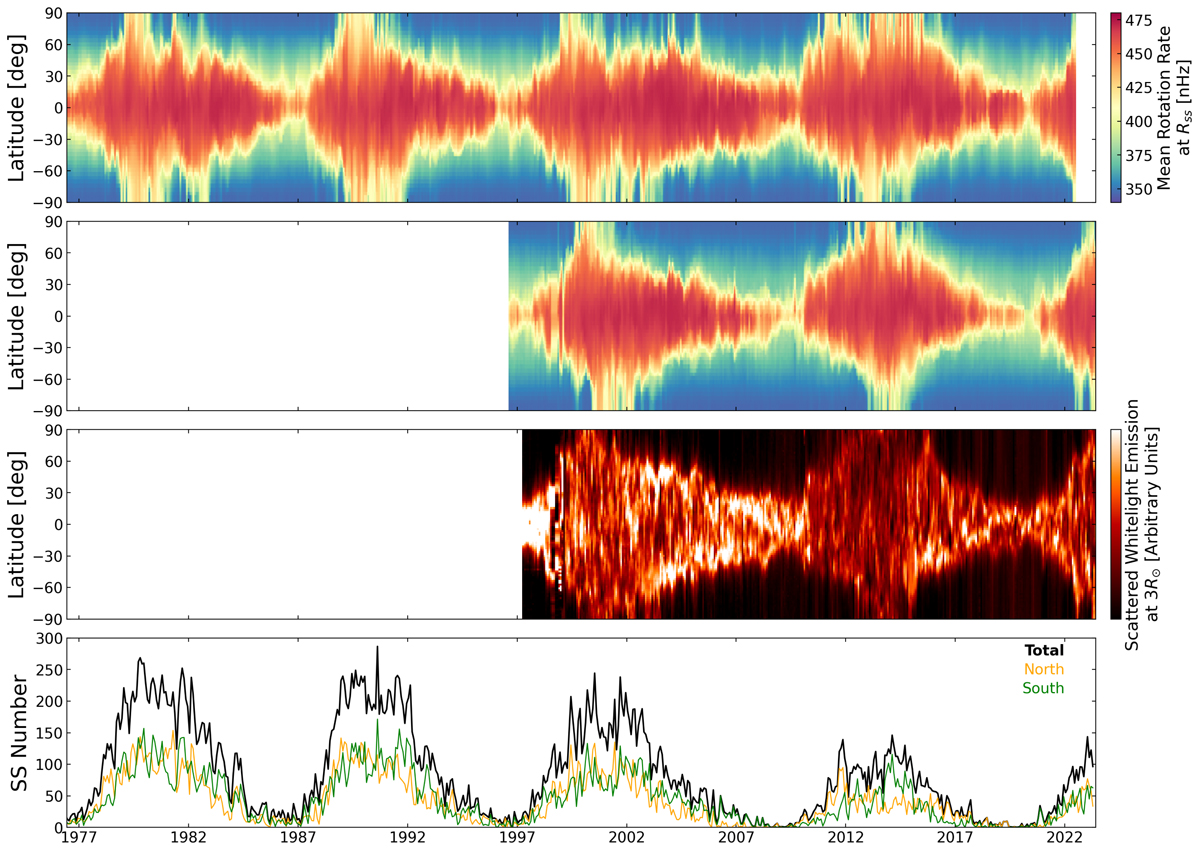
Fig. 9.
Download original image
Solar cycle evolution of coronal rotation. The top two panels show the azimuthally averaged rotation rate at the source surface of the PFSS models using WSO magnetograms (1976–2022) and SOHO/MDI & SDO/HMI magnetograms (1996–present), respectively. The third panel displays the average brightness of scattered white light from streamers at three solar radii observed by SOHO/LASCO-C2. The bottom row displays the monthly sunspot number during this time, taken from WDC-SILSO, along with the contributions from the northern and southern hemispheres individually.
Current usage metrics show cumulative count of Article Views (full-text article views including HTML views, PDF and ePub downloads, according to the available data) and Abstracts Views on Vision4Press platform.
Data correspond to usage on the plateform after 2015. The current usage metrics is available 48-96 hours after online publication and is updated daily on week days.
Initial download of the metrics may take a while.