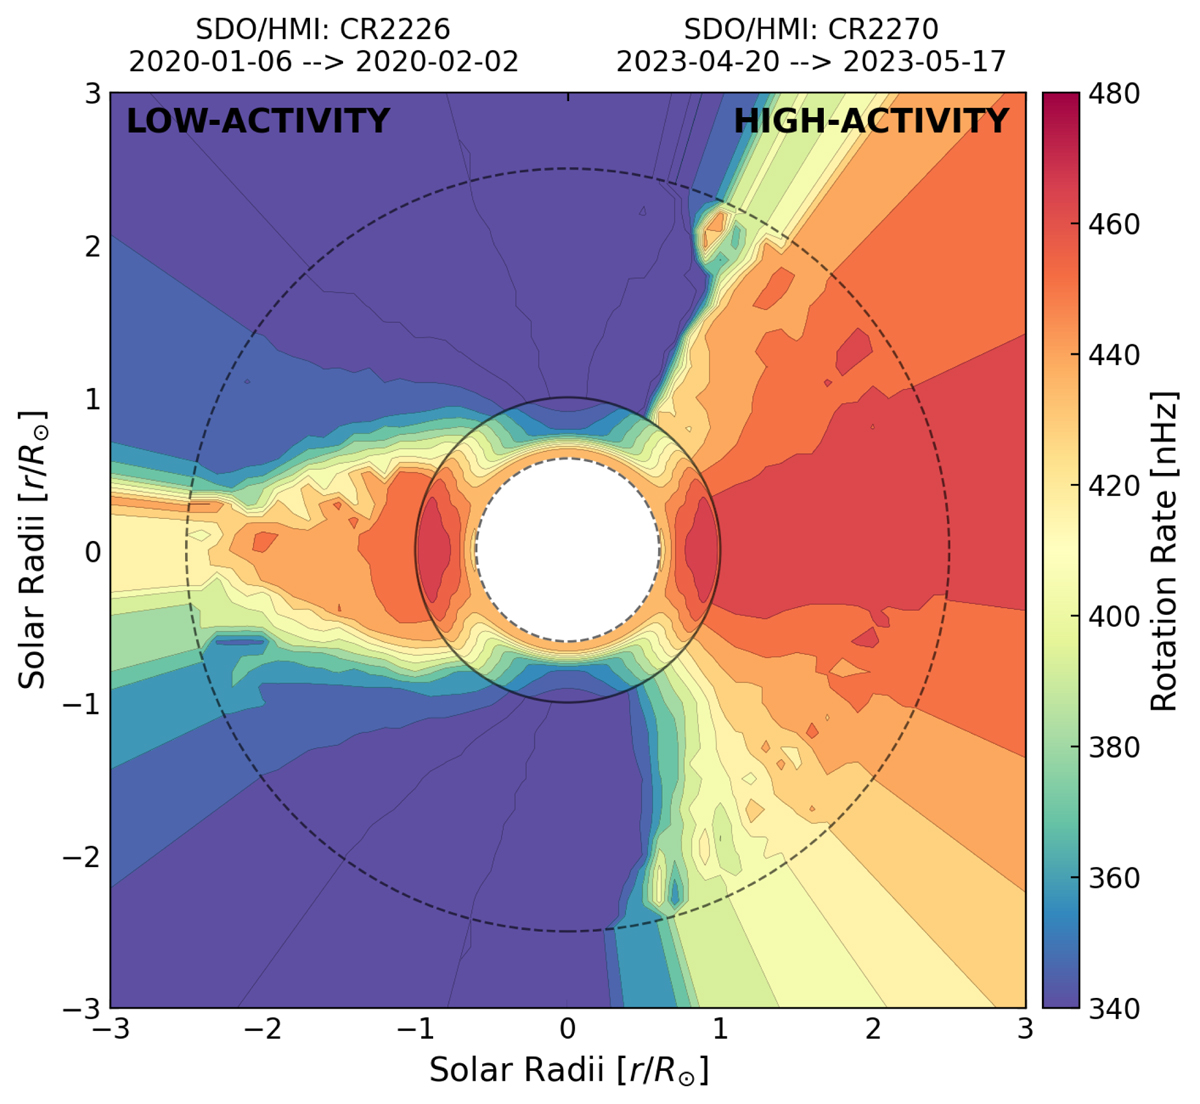
Fig. 8.
Download original image
Comparison of azimuthally averaged footpoint rotation rates in the corona from low solar activity to high solar activity, left and right respectively. The solid black circle distinguishes the solar photosphere, below which the internal rotation profile derived from helioseismology is shown (see Larson & Schou 2018). The outer dashed line shows the source surface of the underlying PFSS model, beyond which the magnetic field is radial.
Current usage metrics show cumulative count of Article Views (full-text article views including HTML views, PDF and ePub downloads, according to the available data) and Abstracts Views on Vision4Press platform.
Data correspond to usage on the plateform after 2015. The current usage metrics is available 48-96 hours after online publication and is updated daily on week days.
Initial download of the metrics may take a while.