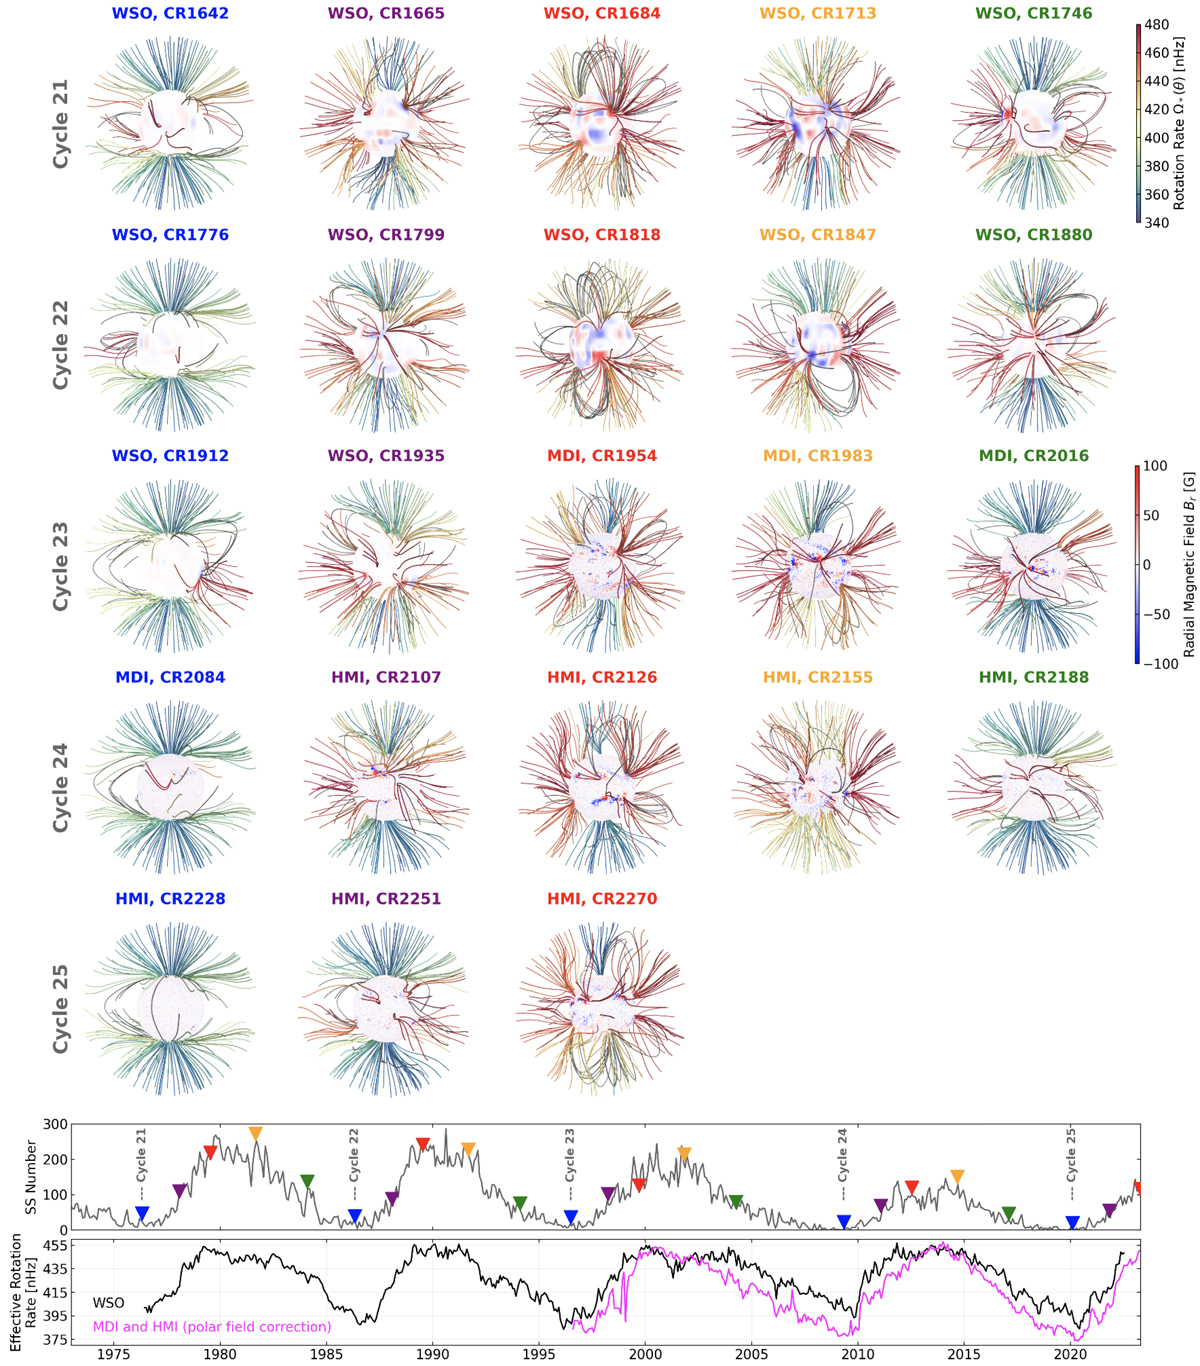
Fig. 7.
Download original image
Snapshots of the coronal magnetic field at; (1) sunspot minimum (blue label), (2) after ∼1.5 yr (purple), (3) after ∼3 yr (red), (4) after ∼5 yr (orange), and (5) after ∼7.5 yr (green), for solar cycles 21–25 (cycle 25 is in progress). Each PFSS field line extrapolation is coloured by the photospheric rotation rate at its footpoint. The surface of each model is coloured by the corresponding radial magnetic field strength. The source of each magnetogram, along with the Carrington rotation number is given in the labels. The monthly sunspot number is shown below, with the time of each snapshot identified by a coloured marker. The bottom row displays the effective rotation rate of the open magnetic field at the source surface (weighted by sin θ), derived from a timeseries of PFSS models using the WSO (black) or SOHO/MDI & SDO/HMI (magenta) Carrington magnetograms.
Current usage metrics show cumulative count of Article Views (full-text article views including HTML views, PDF and ePub downloads, according to the available data) and Abstracts Views on Vision4Press platform.
Data correspond to usage on the plateform after 2015. The current usage metrics is available 48-96 hours after online publication and is updated daily on week days.
Initial download of the metrics may take a while.