Fig. 6.
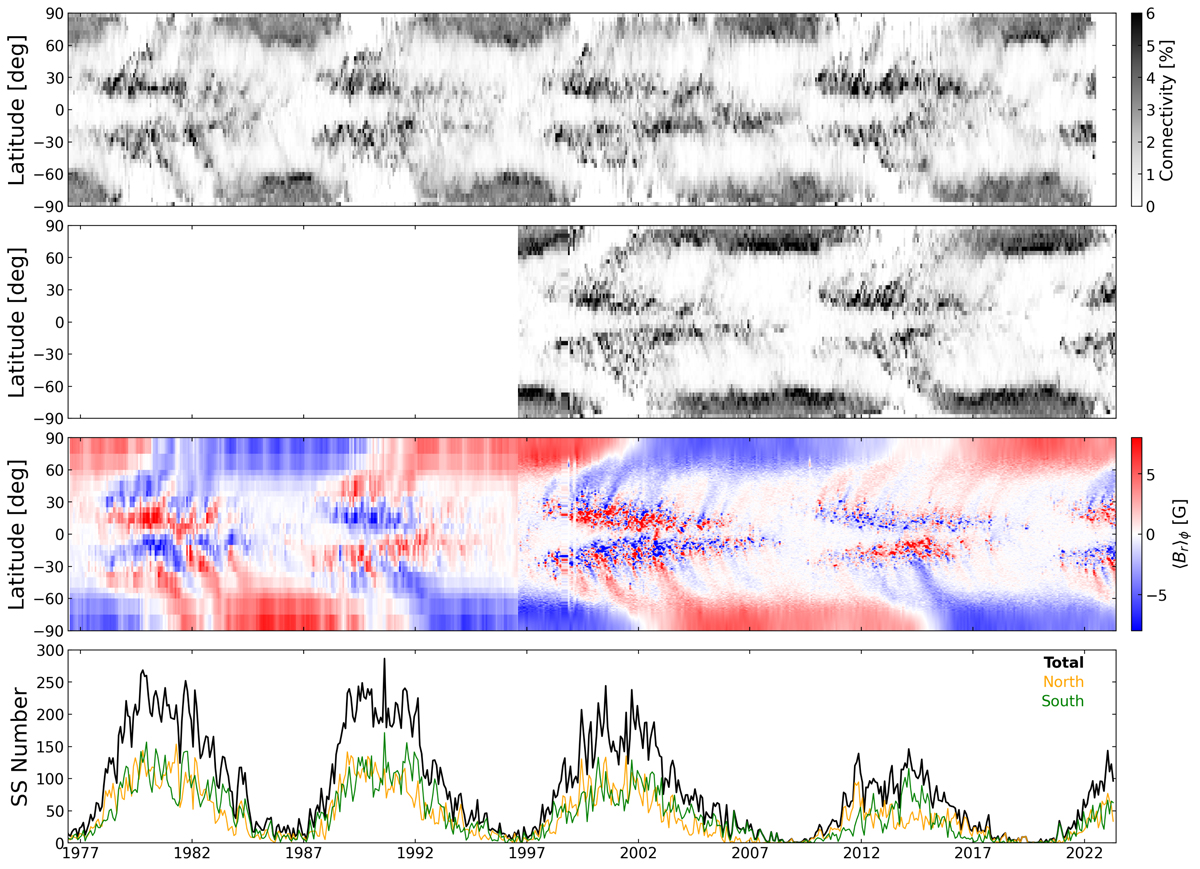
Download original image
Solar cycle evolution of the solar wind footpoints. The top two panels show the fraction of open field lines, in each Carrington rotation, that trace down through the PFSS from a uniform distribution in latitude–longitude at the source surface to a given latitude bin at the surface (width ∼2°) using WSO magnetograms (1976–2022) and SOHO/MDI & SDO/HMI magnetograms (1996–present), respectively (the longitudinal information is ignored, and the connectivity sums to 100% for each Carrington rotation). The third panel displays a combined radial magnetic field butterfly diagram, in which the pole-ward surges of magnetic flux are easily distinguished. The bottom row displays the monthly sunspot number during this time, taken from WDC-SILSO, along with the contributions from the northern and southern hemispheres individually.
Current usage metrics show cumulative count of Article Views (full-text article views including HTML views, PDF and ePub downloads, according to the available data) and Abstracts Views on Vision4Press platform.
Data correspond to usage on the plateform after 2015. The current usage metrics is available 48-96 hours after online publication and is updated daily on week days.
Initial download of the metrics may take a while.