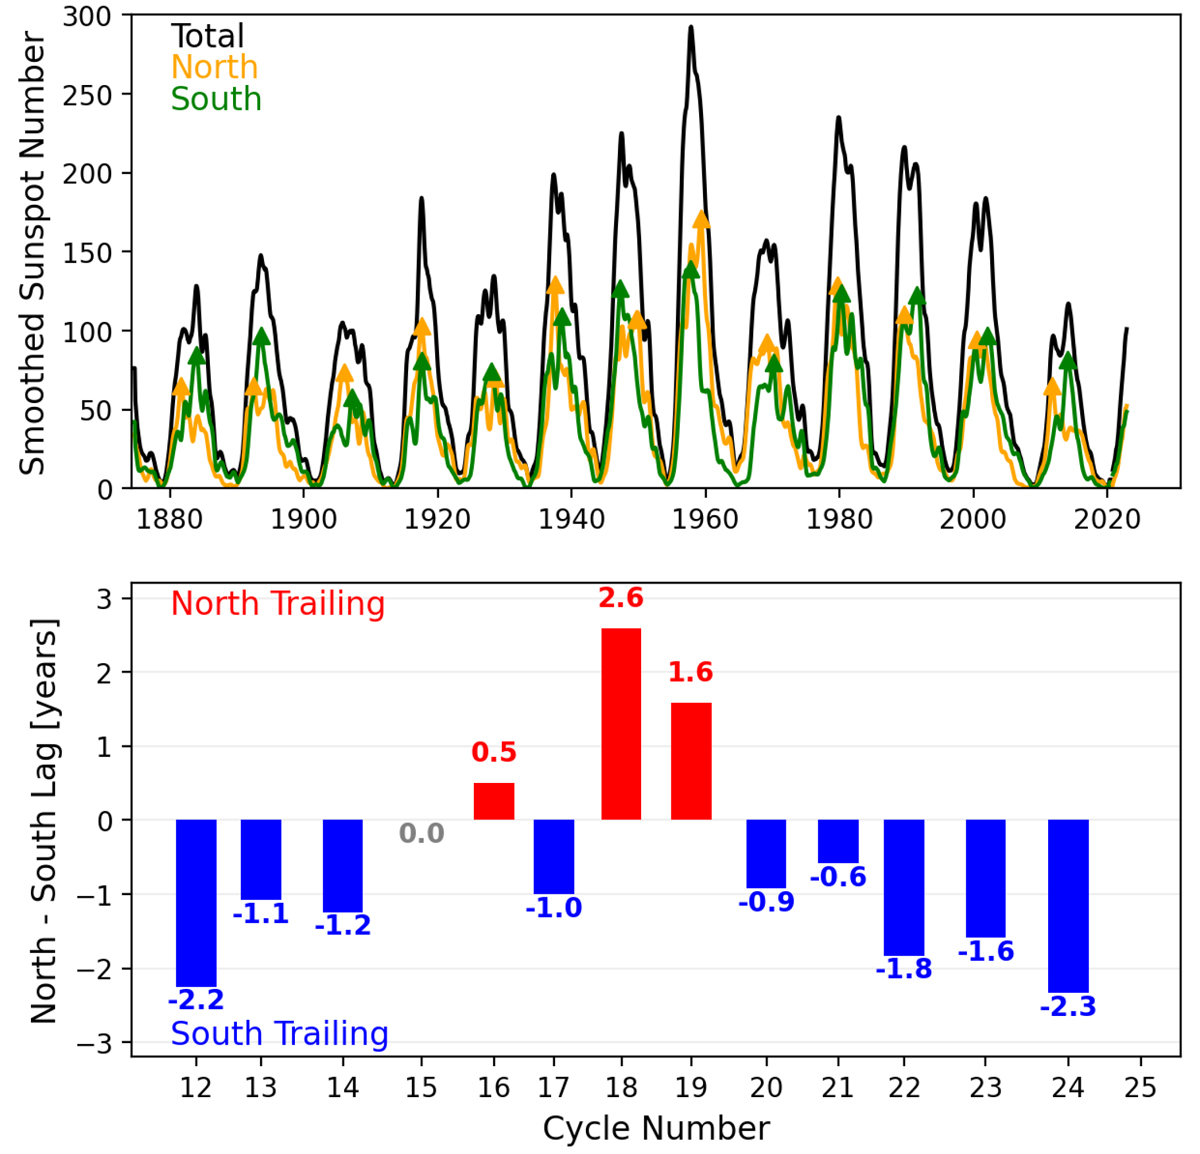
Fig. 2.
Download original image
Smoothed 13-month total and hemispherical sunspot numbers. Maxima in each hemisphere are identified with triangular symbols. The lag times between hemispherical maxima are plotted in the lower panel for each cycle. Cycles 21–24, under investigation in this study, all had activity peaking in the northern hemisphere before the southern hemisphere.
Current usage metrics show cumulative count of Article Views (full-text article views including HTML views, PDF and ePub downloads, according to the available data) and Abstracts Views on Vision4Press platform.
Data correspond to usage on the plateform after 2015. The current usage metrics is available 48-96 hours after online publication and is updated daily on week days.
Initial download of the metrics may take a while.