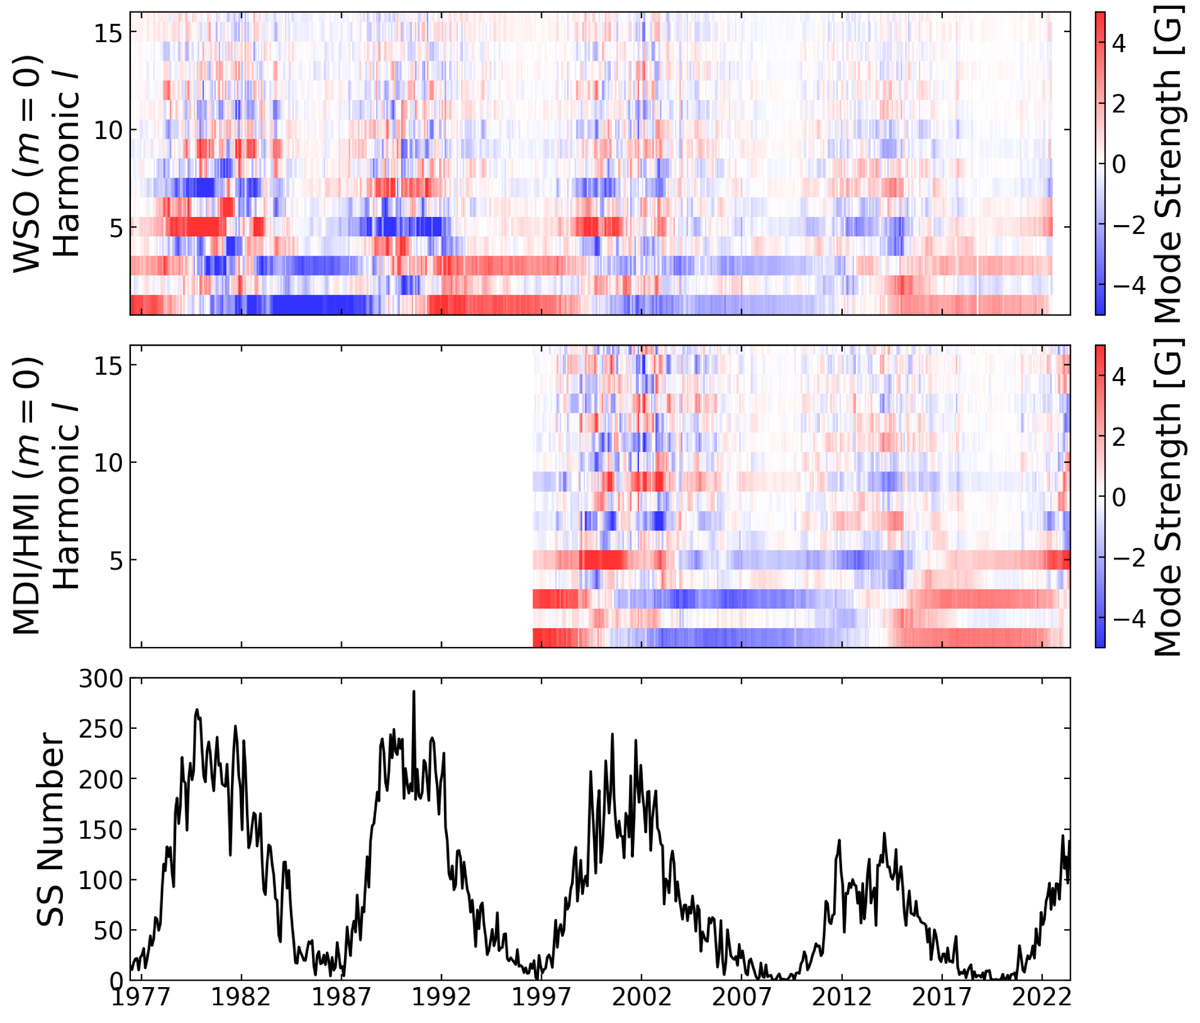
Fig. B.5.
Download original image
Axial (m = 0) mode decomposition of the WSO and SOHO/MDI & SDO/HMI magnetograms, for spherical harmonics up to l = 15. The top row shows the result from WSO (1976-2022) and second row from SOHO/MDI & SDO/HMI (1996-present). Field strengths from WSO are multiplied by a factor of 3.5, to be comparable with SOHO/MDI & SDO/HMI. The bottom row displays the monthly sunspot number during this time, taken from WDC-SILSO.
Current usage metrics show cumulative count of Article Views (full-text article views including HTML views, PDF and ePub downloads, according to the available data) and Abstracts Views on Vision4Press platform.
Data correspond to usage on the plateform after 2015. The current usage metrics is available 48-96 hours after online publication and is updated daily on week days.
Initial download of the metrics may take a while.