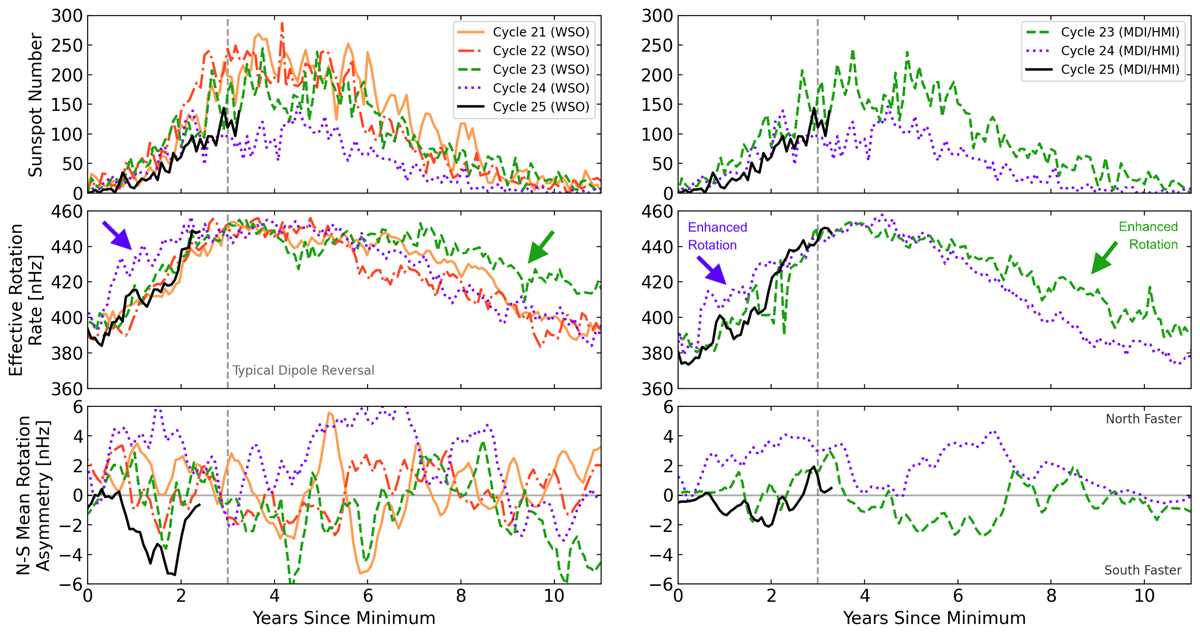
Fig. 10.
Download original image
Solar cycle comparison of the monthly sunspot number, the effective rotation rate, and the hemispherical asymmetry in rotation, from both the WSO, and SOHO/MDI & SDO/HMI timeseries. Each cycle is given a different line colour and style, cycle 25 is highlighted with a solid black line. Quantities are plotted with respect to the smoothed sunspot minima time of each cycle.
Current usage metrics show cumulative count of Article Views (full-text article views including HTML views, PDF and ePub downloads, according to the available data) and Abstracts Views on Vision4Press platform.
Data correspond to usage on the plateform after 2015. The current usage metrics is available 48-96 hours after online publication and is updated daily on week days.
Initial download of the metrics may take a while.