Fig. 1.
Download original image
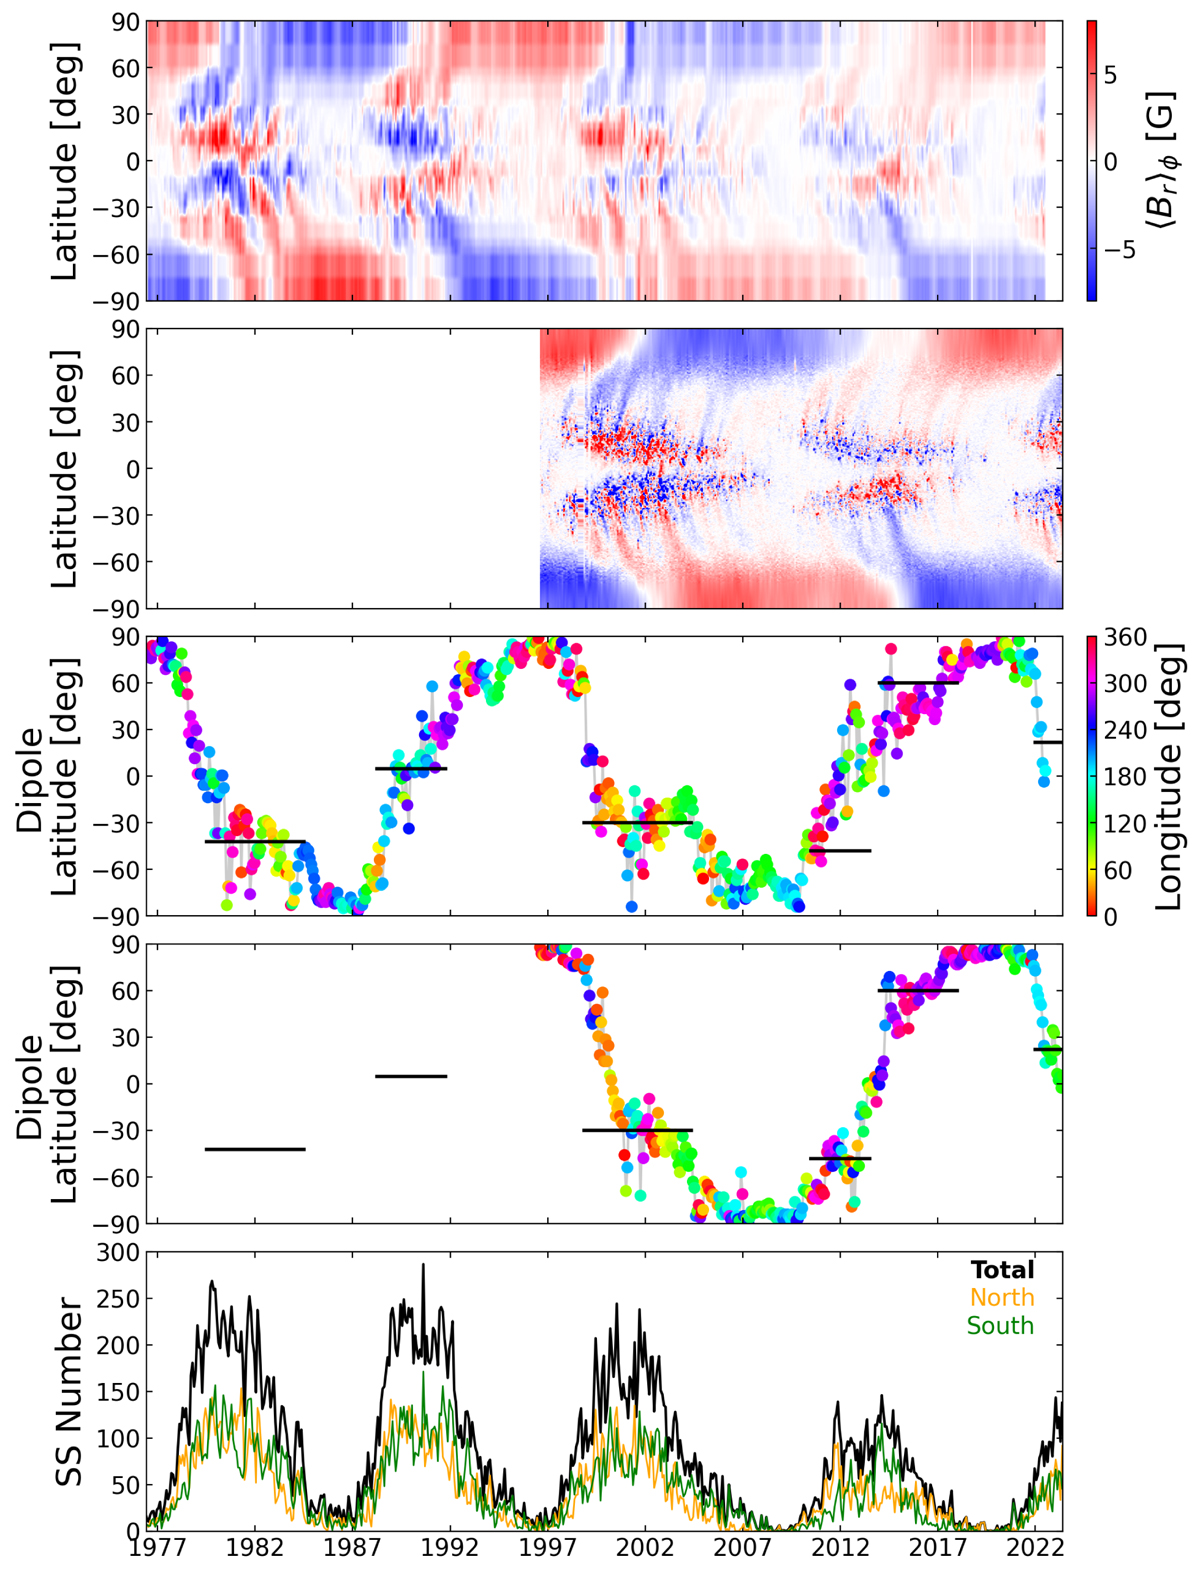
Evolution of the Sun’s radial magnetic field from WSO and SOHO/MDI & SDO/HMI timeseries. The top two panels show azimuthally averaged Carrington magnetograms from WSO (1976–2022) and from SOHO/MDI & SDO/HMI (1996–present). The following two panels show the latitude of the solar dipole (positive pole) deduced from the spherical harmonic-decomposition of the magnetograms from WSO, and SOHO/MDI & SDO/HMI, respectively. The Carrington longitude of the dipole (positive pole) is then indicated in colour. Epochs where the dipole reversal appears to stall are highlighted with black horizontal bars. The bottom row displays the monthly sunspot number during this time, taken from WDC-SILSO, along with the contributions from the northern and southern hemispheres individually.
Current usage metrics show cumulative count of Article Views (full-text article views including HTML views, PDF and ePub downloads, according to the available data) and Abstracts Views on Vision4Press platform.
Data correspond to usage on the plateform after 2015. The current usage metrics is available 48-96 hours after online publication and is updated daily on week days.
Initial download of the metrics may take a while.