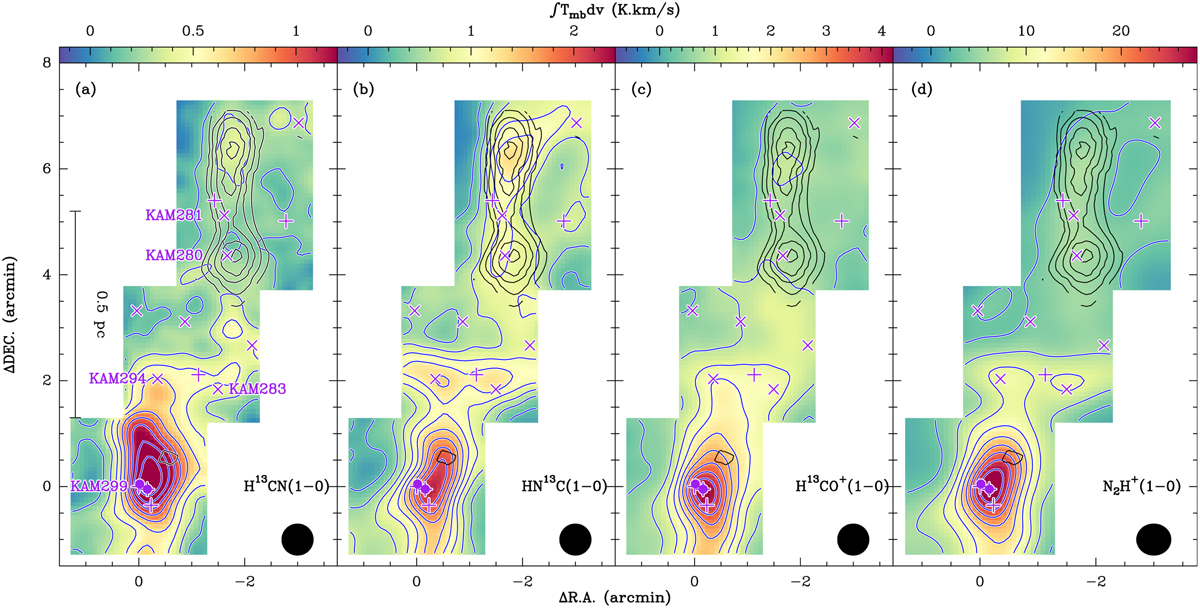
Fig. 6
Download original image
Comparison of different tracers in Serpens South. Integrated-intensity maps (on a color scale) of (a) H13CN (1−0), (b) HN13C (1−0), (c) H13CO+ (1−0), and (d) N2H+ (1−0). The blue contours represent the respective integrated intensities. They vary from 10% to 90% of the peak integrated intensities in steps of 10%, where the peak integrated intensities are 1.57 K km s−1, 2.25 K km s−1, 4.26 K km s−1, and 30.24 K km s−1 for H13CN (1−0), HN13C (1−0), H13CO+ (1−0), and N2H+ (1−0), respectively. The black contours of HCNH+ (2−1) integrated intensities are the same as in Fig. 2a. The intensity was integrated over 7−9.5 km s−1 for H13CN (1−0), HN13C (1−0), and H13CO+ (1−0), while a broader range (5−9.5 km s−1) was chosen to cover the three main HFS components of N2H+ (1−0). The beam size is shown in the lower-right corner of each panel. In all panels, the (0, 0) offset corresponds to αJ2000=18h30m04s.19, δJ2000=−02°03′05″.5. The markers are the same as in Fig. 2.
Current usage metrics show cumulative count of Article Views (full-text article views including HTML views, PDF and ePub downloads, according to the available data) and Abstracts Views on Vision4Press platform.
Data correspond to usage on the plateform after 2015. The current usage metrics is available 48-96 hours after online publication and is updated daily on week days.
Initial download of the metrics may take a while.