Open Access
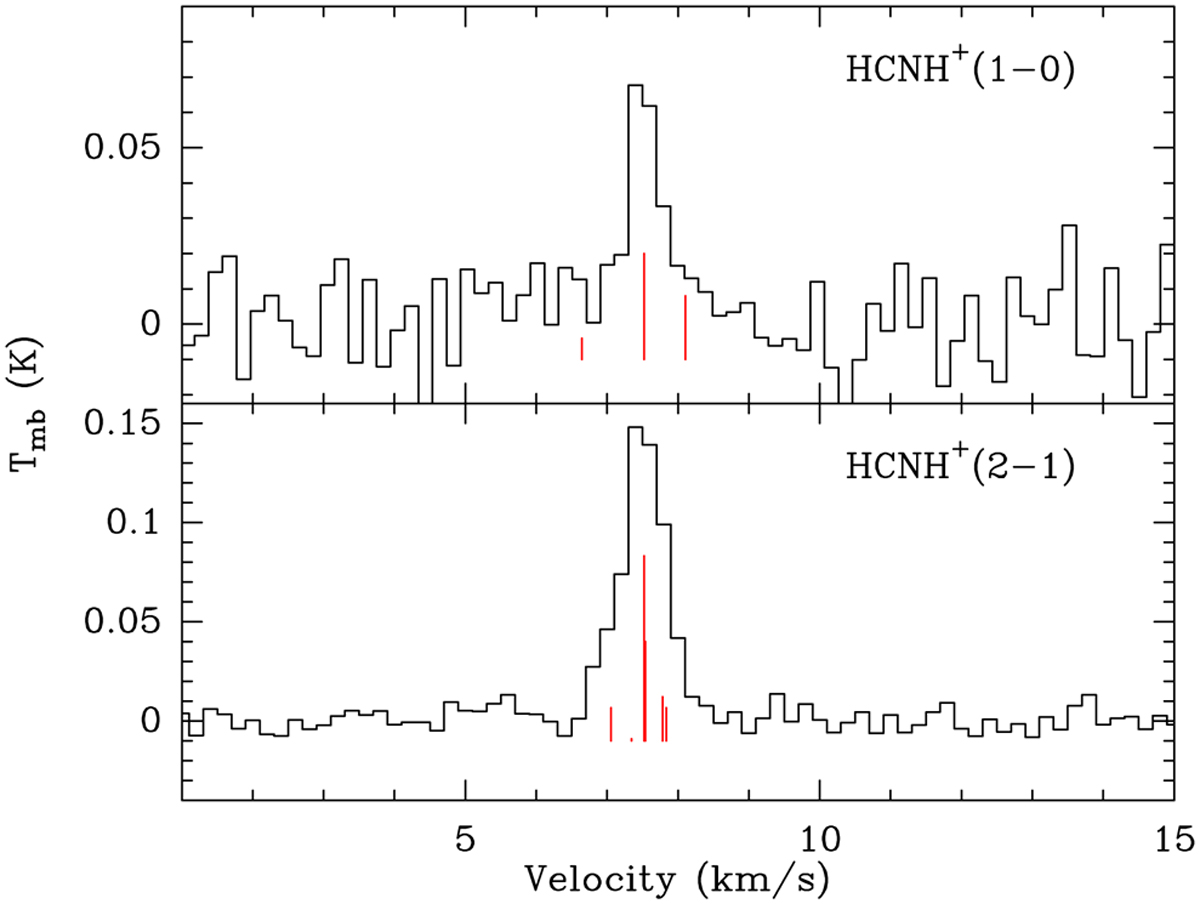
Fig. 4
Download original image
HCNH+ (1–0) and HCNH+ (2–1) spectra averaged over the region where HCNH+ (2–1) integrated intensities are higher than 3σ in Fig. 2. The positions and relative intensities of the HFS components are indicated by the vertical red lines.
Current usage metrics show cumulative count of Article Views (full-text article views including HTML views, PDF and ePub downloads, according to the available data) and Abstracts Views on Vision4Press platform.
Data correspond to usage on the plateform after 2015. The current usage metrics is available 48-96 hours after online publication and is updated daily on week days.
Initial download of the metrics may take a while.