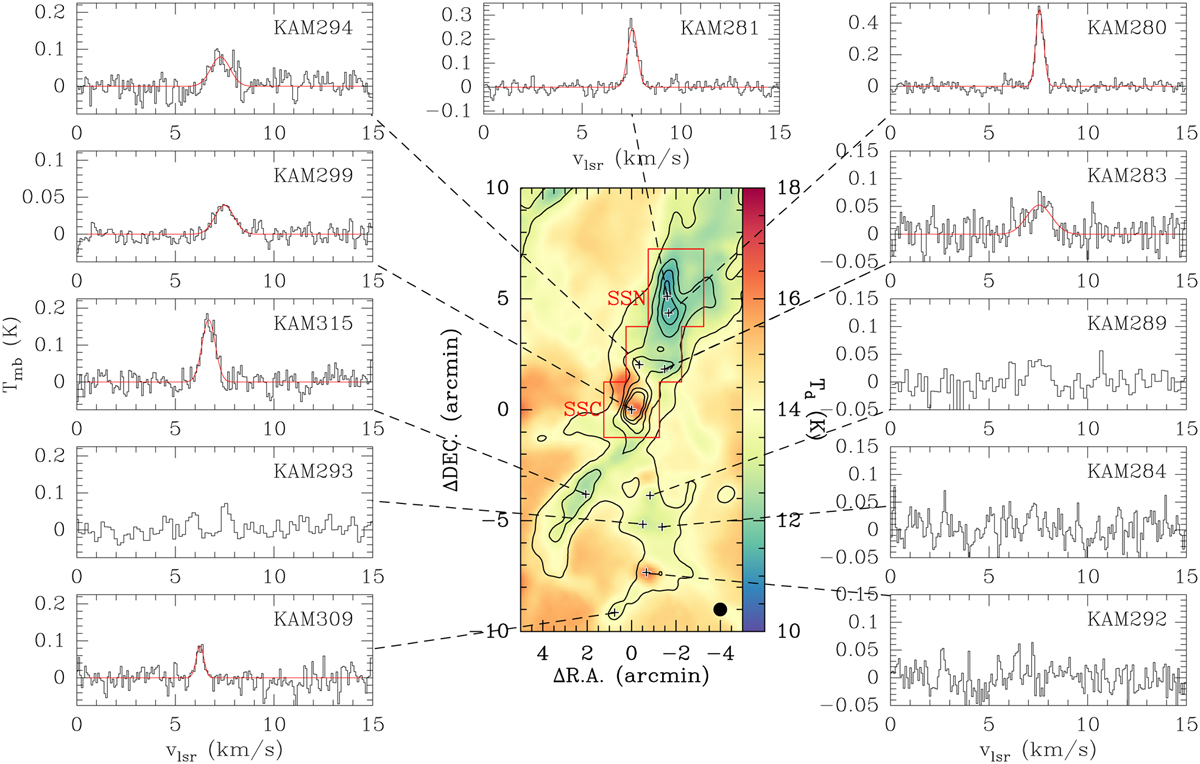
Fig. 3
Download original image
Herschel dust temperature map of Serpens South (Könyves et al. 2015) overlaid with H2 column density contours that start at 2 × 1022 cm−2 and increase in steps of 2×1022 cm−2. The beam size is shown in the lower-right corner of the central panel. The (0, 0) offset corresponds to αJ2000 = 18h30m04.19, δJ2000 = −02°03′05″.5. The region mapped in HCNH+ (2−1) is indicated by the red boundary. The positions toward which pointed observations of HCNH+ (3−2) were carried out are indicated by the black plus signs in Serpens South. Observed HCNH+ (3−2) spectra are displayed in black, while Gaussian fits to the line profiles are shown in red. The source name is indicated in the upper-right corner of each panel.
Current usage metrics show cumulative count of Article Views (full-text article views including HTML views, PDF and ePub downloads, according to the available data) and Abstracts Views on Vision4Press platform.
Data correspond to usage on the plateform after 2015. The current usage metrics is available 48-96 hours after online publication and is updated daily on week days.
Initial download of the metrics may take a while.