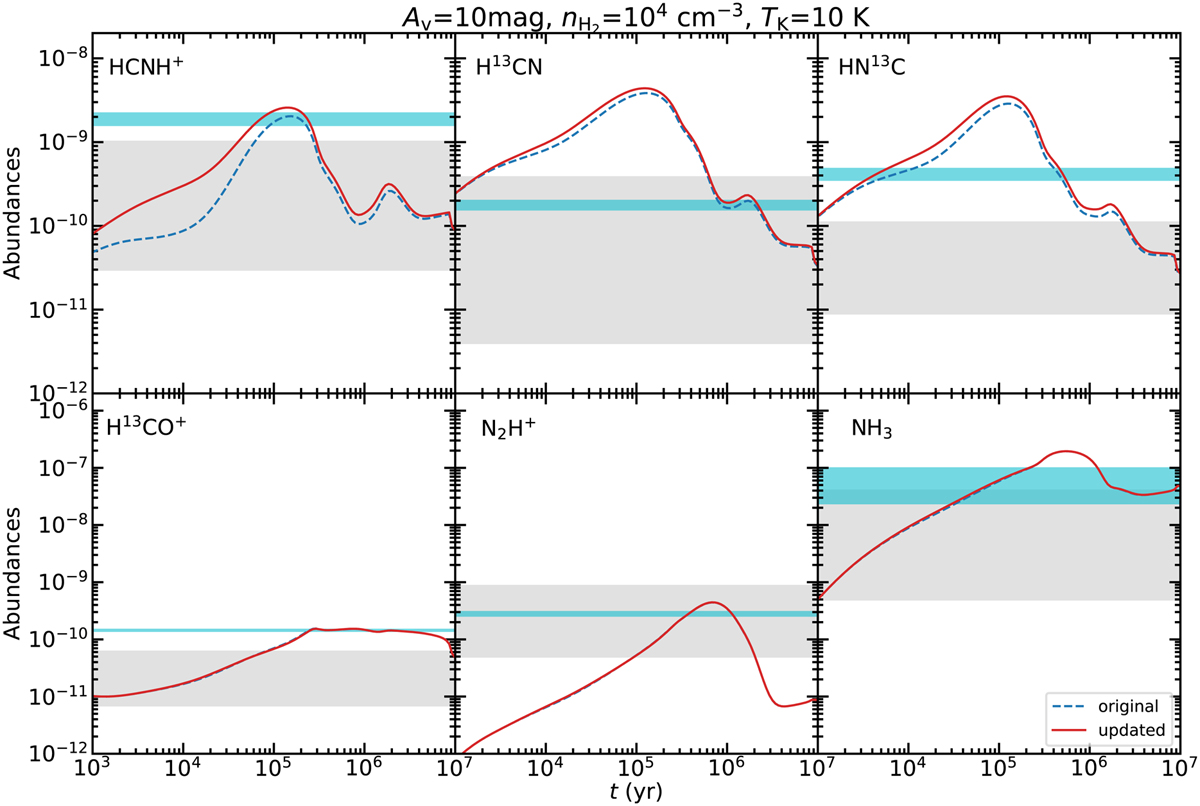
Fig. C.1
Download original image
Molecular abundances relative to H2 as a function of time, calculated from Chempl (Du 2021). The dashed blue lines represent the modeling results in Sect. 4.2, while the solid red curves represent the modeling results obtained when including reaction (7) in the underlying chemical network. The observed molecular abundances in our studies are indicated by the gray shaded regions, while the molecular abundances in TMC1 (Agúndez & Wakelam 2013) are indicated by the cyan shaded regions. The other physical conditions are indicated at the top of this figure.
Current usage metrics show cumulative count of Article Views (full-text article views including HTML views, PDF and ePub downloads, according to the available data) and Abstracts Views on Vision4Press platform.
Data correspond to usage on the plateform after 2015. The current usage metrics is available 48-96 hours after online publication and is updated daily on week days.
Initial download of the metrics may take a while.