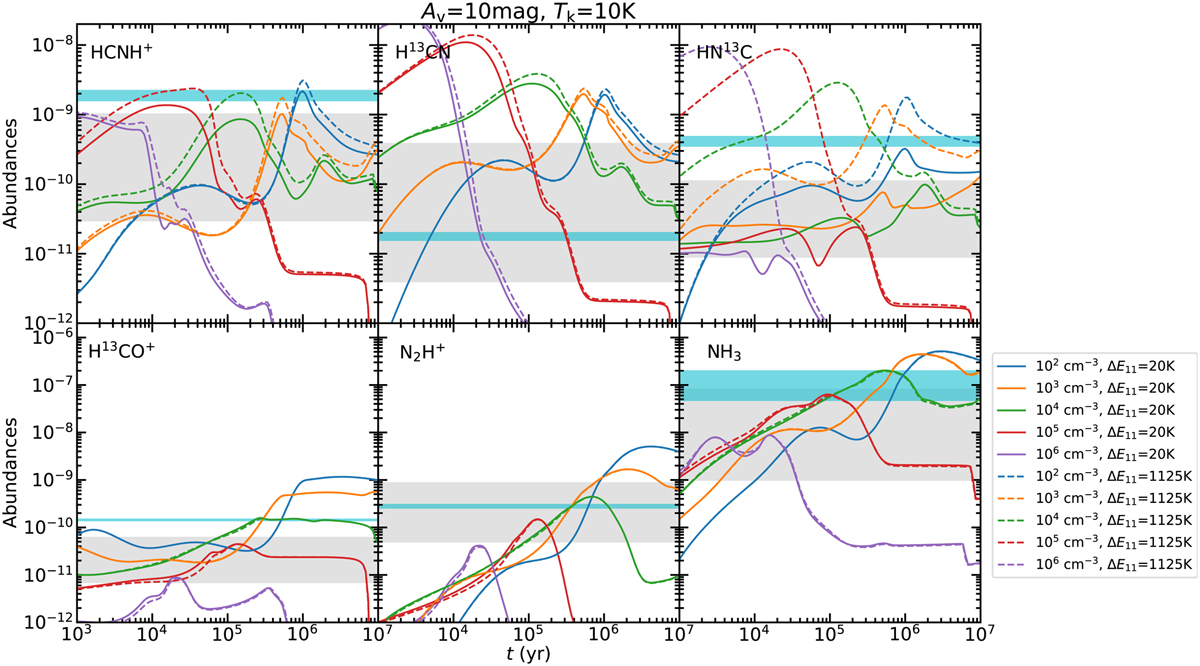
Fig. 19
Download original image
Molecular abundances relative to H2 as a function of time, estimated from Chempl (Du 2021). The different colors correspond to the different H2 number densities, from 102 cm−3 to 106 cm−3. The solid and dashed lines represent the modeling results with the energy barrier ∆E11 =20 K and ∆E11 =1125 K for reaction (11), respectively. The observed molecular abundances in our studies are indicated by the gray shaded regions, while the molecular abundances in TMC1 (Agúndez & Wakelam 2013) are indicated by the cyan shaded regions.
Current usage metrics show cumulative count of Article Views (full-text article views including HTML views, PDF and ePub downloads, according to the available data) and Abstracts Views on Vision4Press platform.
Data correspond to usage on the plateform after 2015. The current usage metrics is available 48-96 hours after online publication and is updated daily on week days.
Initial download of the metrics may take a while.