Open Access
Fig. 13
Download original image
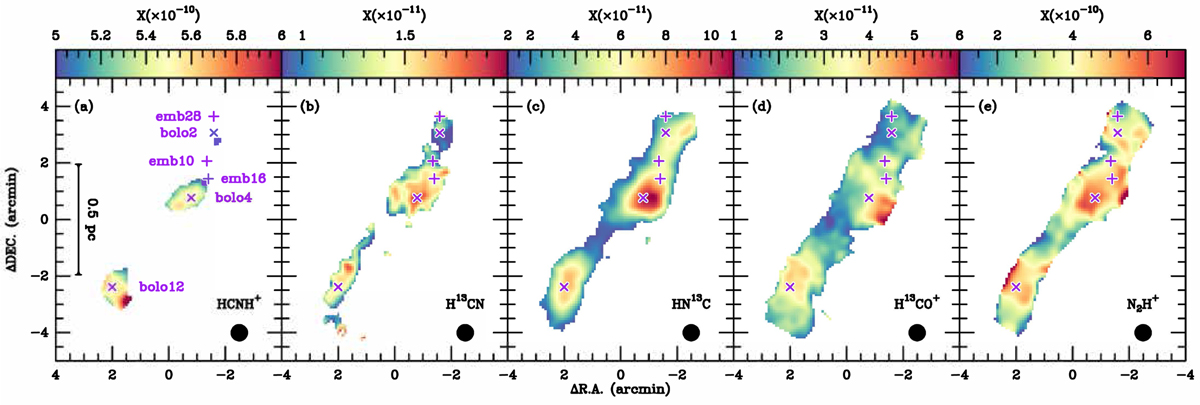
Molecular abundance distributions in the Serpens filament. (a) HCNH+, (b) H13CN, (c) HN13C, (d) H13CO+, and (e) N2H+. The beam size is shown in the lower-right corner of each panel. In all panels, the (0, 0) offset corresponds to αJ2000=18h28m50s.4, δJ2000 =00°49′58″.72. The markers are the same as in Fig. 1.
Current usage metrics show cumulative count of Article Views (full-text article views including HTML views, PDF and ePub downloads, according to the available data) and Abstracts Views on Vision4Press platform.
Data correspond to usage on the plateform after 2015. The current usage metrics is available 48-96 hours after online publication and is updated daily on week days.
Initial download of the metrics may take a while.