Fig. 11
Download original image
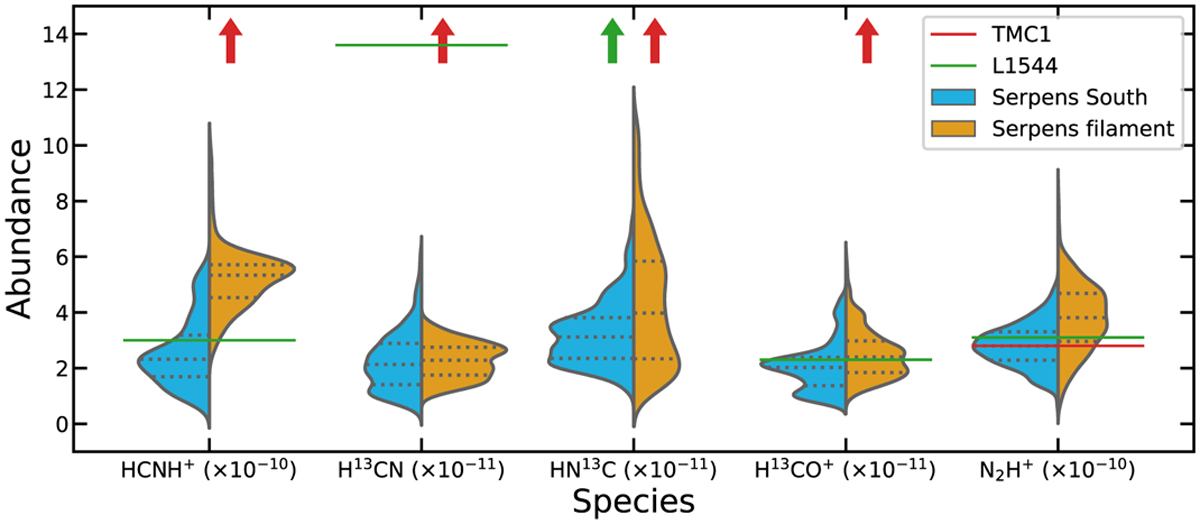
Comparison of the fractional abundances of different species with respect to H2 determined on a pixel-by-pixel basis. The y-axis has been divided by the scaling values, which are given in parentheses after the molecule names along the x-axis for better visualization. The dotted lines indicate the 25%, 50%, and 75% percentiles of the respective distributions. The molecular abundances in TMC1 and L1544 are also indicated for comparison. The arrows indicate that their abundances are higher than the maximum value on the y-axis.
Current usage metrics show cumulative count of Article Views (full-text article views including HTML views, PDF and ePub downloads, according to the available data) and Abstracts Views on Vision4Press platform.
Data correspond to usage on the plateform after 2015. The current usage metrics is available 48-96 hours after online publication and is updated daily on week days.
Initial download of the metrics may take a while.