Fig. 1
Download original image
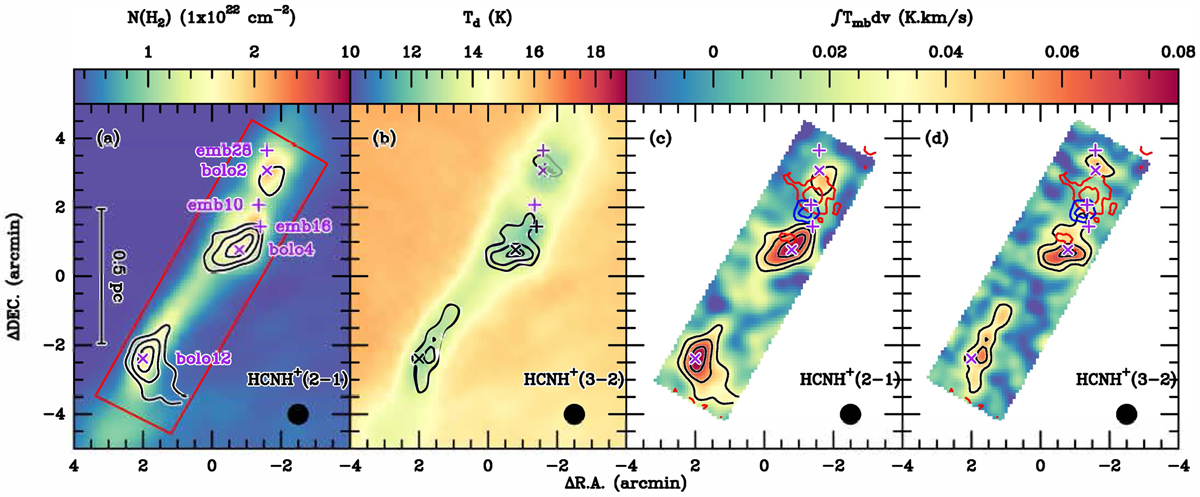
Distribution of HCNH+ in the Serpens filament. (a) Herschel H2 column density map of the Serpens filament (Fiorellino et al. 2021) overlaid with the HCNH+ (2−1) integrated intensity contours. The velocity range over which the HCNH+ (2−1) intensity map is integrated is 7.7–8.7 km s−1. The contours start at 0.03 K km s−1 (3σ) and increase in steps of 0.02 K km s−1. The red boundary represents the region mapped by our IRAM 30 m and APEX 12 m observations. (b) Herschel dust temperature map (Fiorellino et al. 2021) overlaid with the HCNH+ (3−2) integrated intensity contours. The velocity range over which the HCNH+ (3−2) intensity is integrated is 7.7–8.7 km s−1. The contours start at 0.03 K km s−1 (3σ) and increase in steps of 0.02 K km s−1. (c) HCNH+ (2−1) integrated intensity map overlaid with the blueshifted and redshifted outflow lobes of 13CO (2−1) that are driven by emb10 (Gong et al. 2021). The black contours are the same as in panel a. (d) Similar to panel c, but for HCNH+ (3−2). The beam size is shown in the lower-right corner of each panel. In all panels, the (0, 0) offset corresponds to αJ2000=18h28m50s.4, δJ2000 =00°49′58″.72. The three purple plus signs indicate the positions of the three embedded YSOs, emb10, emb16, and emb 28 (Enoch et al. 2009), while the three purple crosses mark the positions of three 1.1 mm dust continuum cores, bolo2, bolo4, and bolo12 (Enoch et al. 2007).
Current usage metrics show cumulative count of Article Views (full-text article views including HTML views, PDF and ePub downloads, according to the available data) and Abstracts Views on Vision4Press platform.
Data correspond to usage on the plateform after 2015. The current usage metrics is available 48-96 hours after online publication and is updated daily on week days.
Initial download of the metrics may take a while.