Open Access
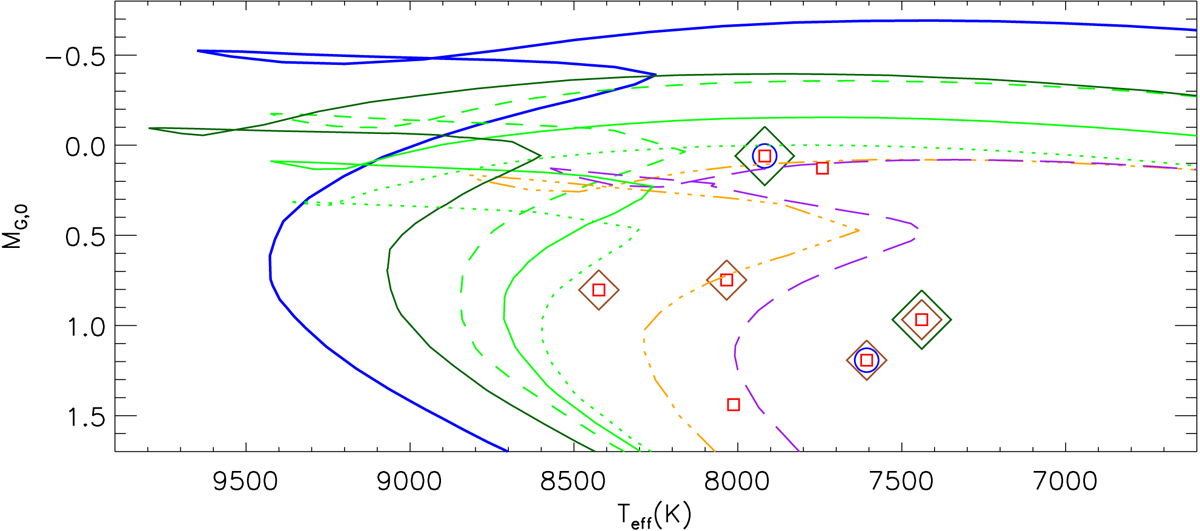
Fig. 9.
Download original image
Hertzsprung-Russel diagram zoom on the upper main sequence. As in the lower left panel of Fig. 1 but with the x-axis colour replaced by Teff, and only showing stars with spectroscopic Teff measurements in Frasca et al. (2016). For clarity, only some of the isochrones from Fig. 1 are repeated.
Current usage metrics show cumulative count of Article Views (full-text article views including HTML views, PDF and ePub downloads, according to the available data) and Abstracts Views on Vision4Press platform.
Data correspond to usage on the plateform after 2015. The current usage metrics is available 48-96 hours after online publication and is updated daily on week days.
Initial download of the metrics may take a while.