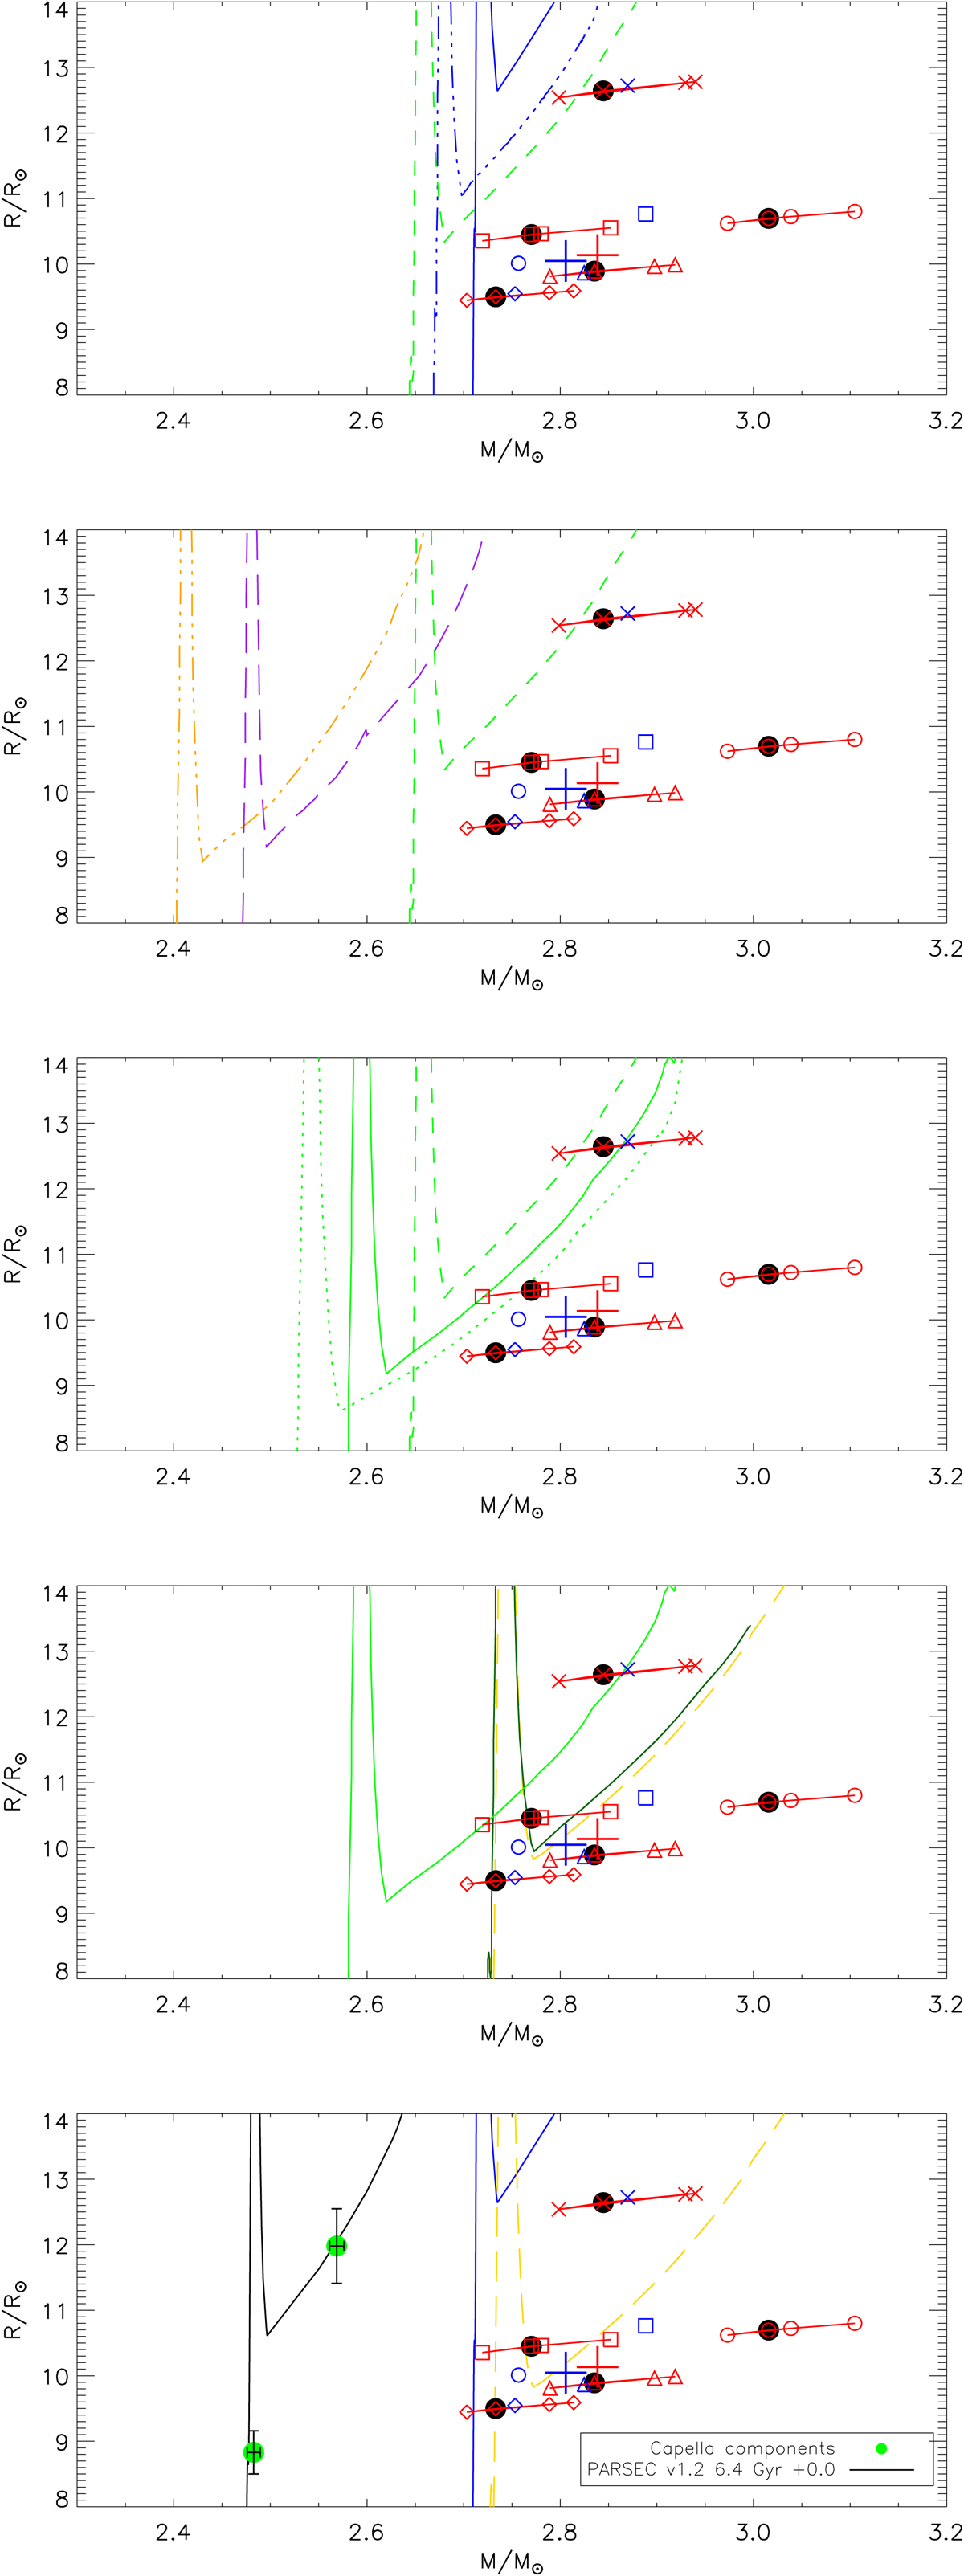
Fig. 8.
Download original image
Mass–radius diagrams. Details are the same as in Fig. 7, but showing different subsets of the isochrones. Isochrones are given in the legend of Fig. 7. From top to bottom: (a) effects of different isochrone sets, (b) effects of age and metallicity, (c) effects of changing core-overshoot efficiency, (d) best age estimates and negligible effects of diffusion in the mass–radius relation, and (e) comparison to parameters of Capella. Bottom panel: green circles mark the masses and radii of Capella measured by Torres et al. (2015), see Sect. 6. The lower mass component is in the Hertzsprung gap and the higher mass component is in the HeCB phase.
Current usage metrics show cumulative count of Article Views (full-text article views including HTML views, PDF and ePub downloads, according to the available data) and Abstracts Views on Vision4Press platform.
Data correspond to usage on the plateform after 2015. The current usage metrics is available 48-96 hours after online publication and is updated daily on week days.
Initial download of the metrics may take a while.