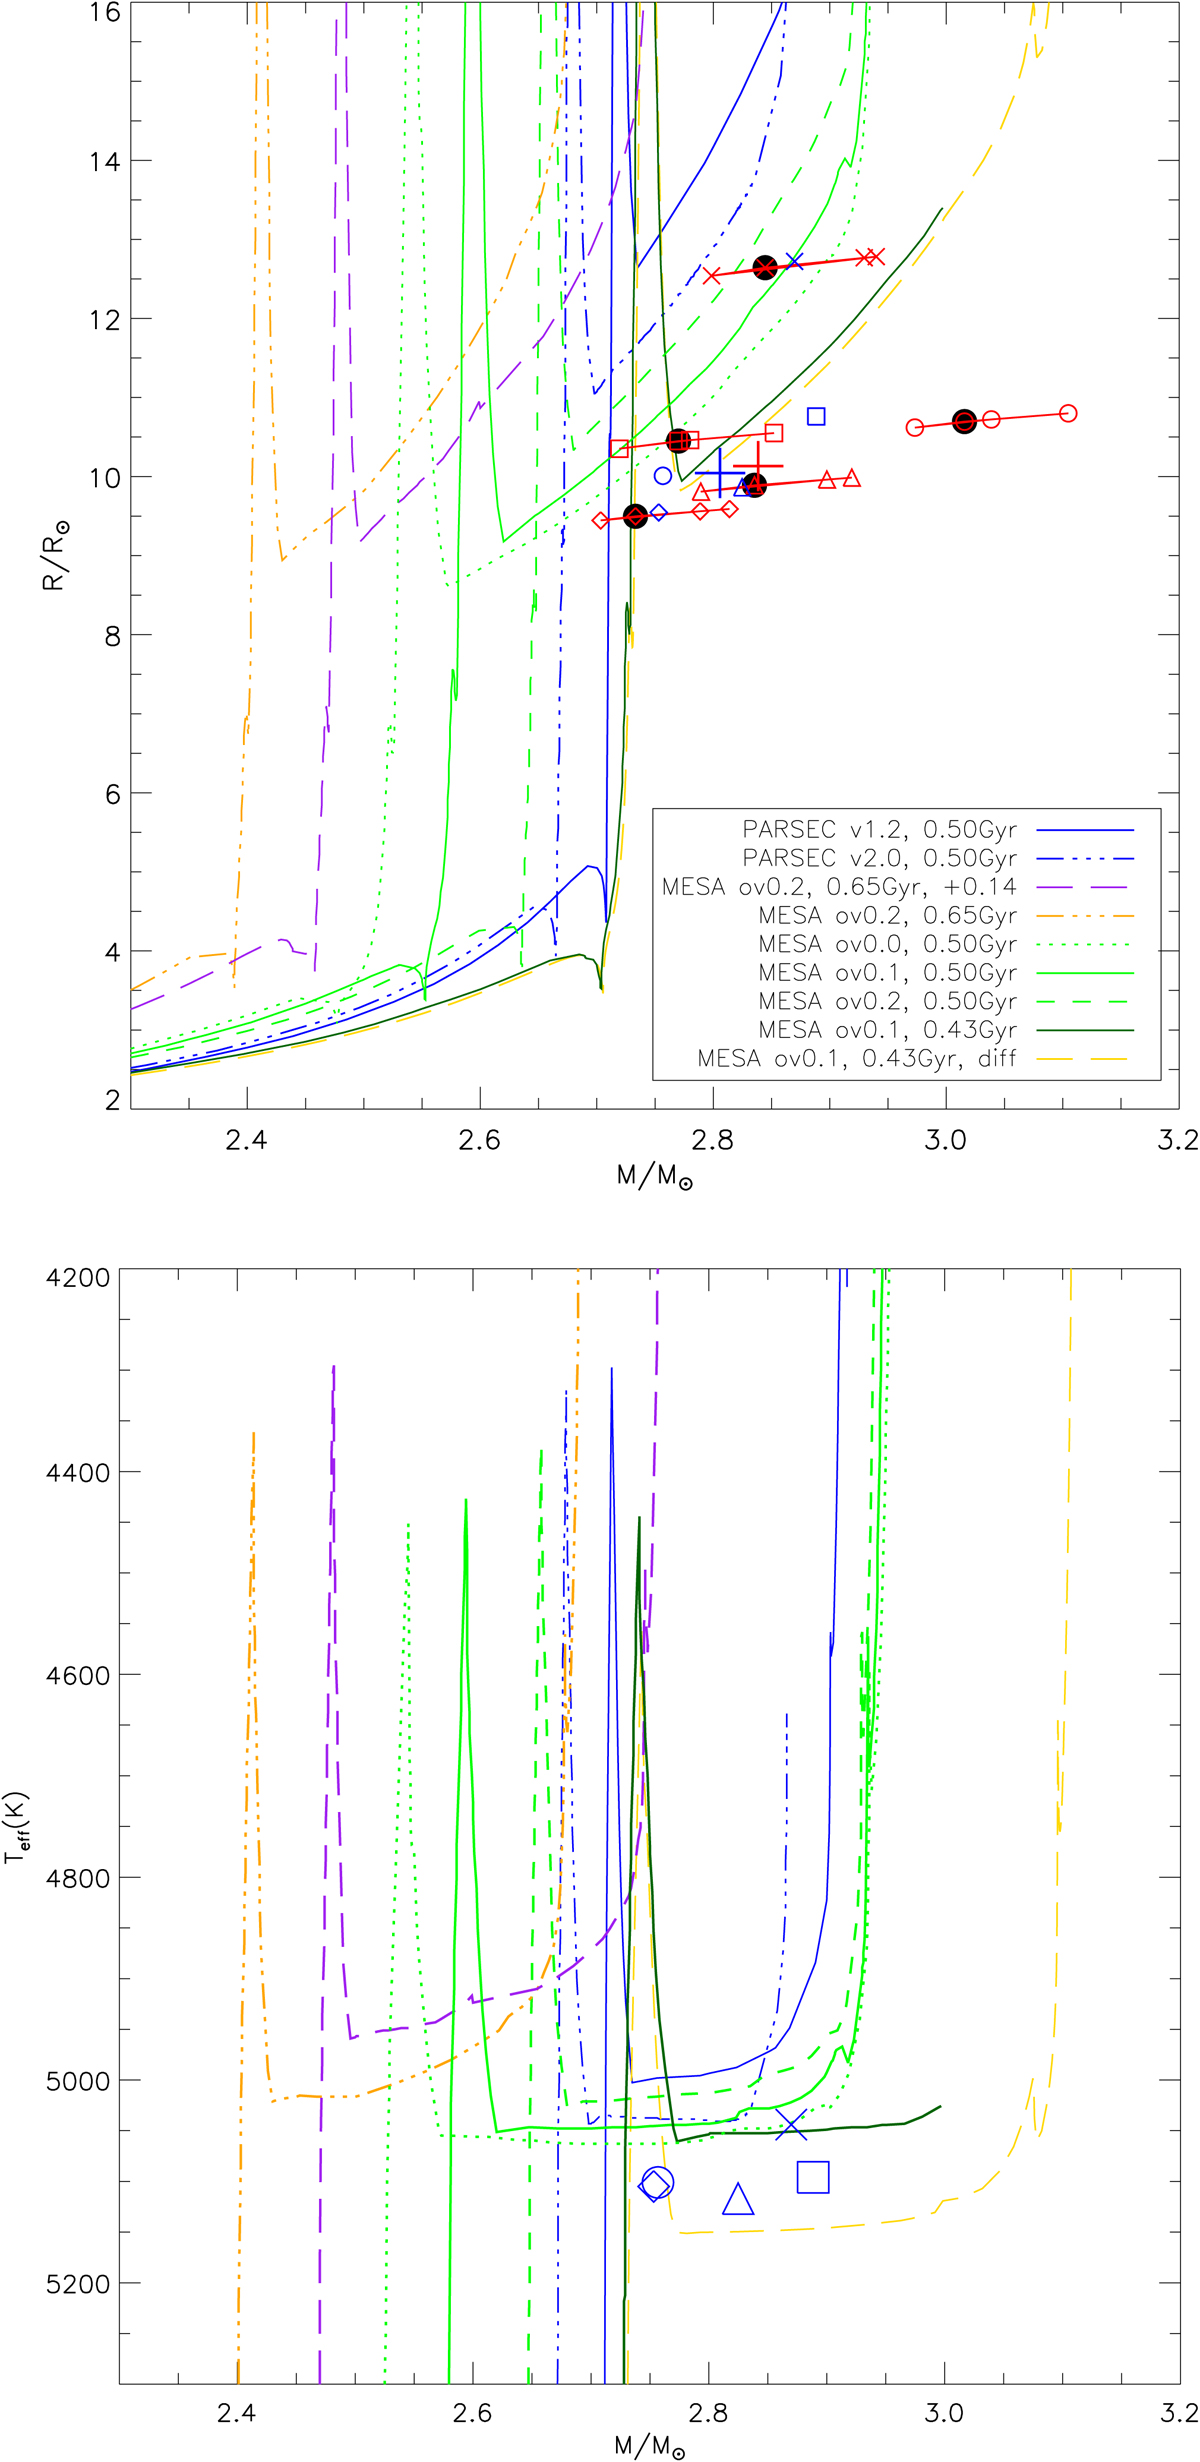
Fig. 7.
Download original image
Mass–radius and mass–Teff diagrams of the NGC 6866 giants. Upper panel: mass–radius diagram. Black filled circles mark the measured masses and radii of the NGC 6866 giants according to Eqs. (1) and (2). Red symbols mark the same values and those corresponding to adding, in turn, 1σ to Δν (leftmost point), νmax, and Teff (rightmost point). Blue symbols mark the mean masses of Eqs. (2)–(5) and radii from the Stefan–Boltzmann equation. The red and blue plus signs mark the mean masses and radii of the red and blue symbols, respectively, not counting the most evolved star. Details of the isochrones are given in the legend. Lower panel: mass–Teff diagram. Isochrones are the same as in the upper panel. Blue symbols mark the mean masses of Eqs. (2)–(5) and Teff values from APOGEE DR17.
Current usage metrics show cumulative count of Article Views (full-text article views including HTML views, PDF and ePub downloads, according to the available data) and Abstracts Views on Vision4Press platform.
Data correspond to usage on the plateform after 2015. The current usage metrics is available 48-96 hours after online publication and is updated daily on week days.
Initial download of the metrics may take a while.