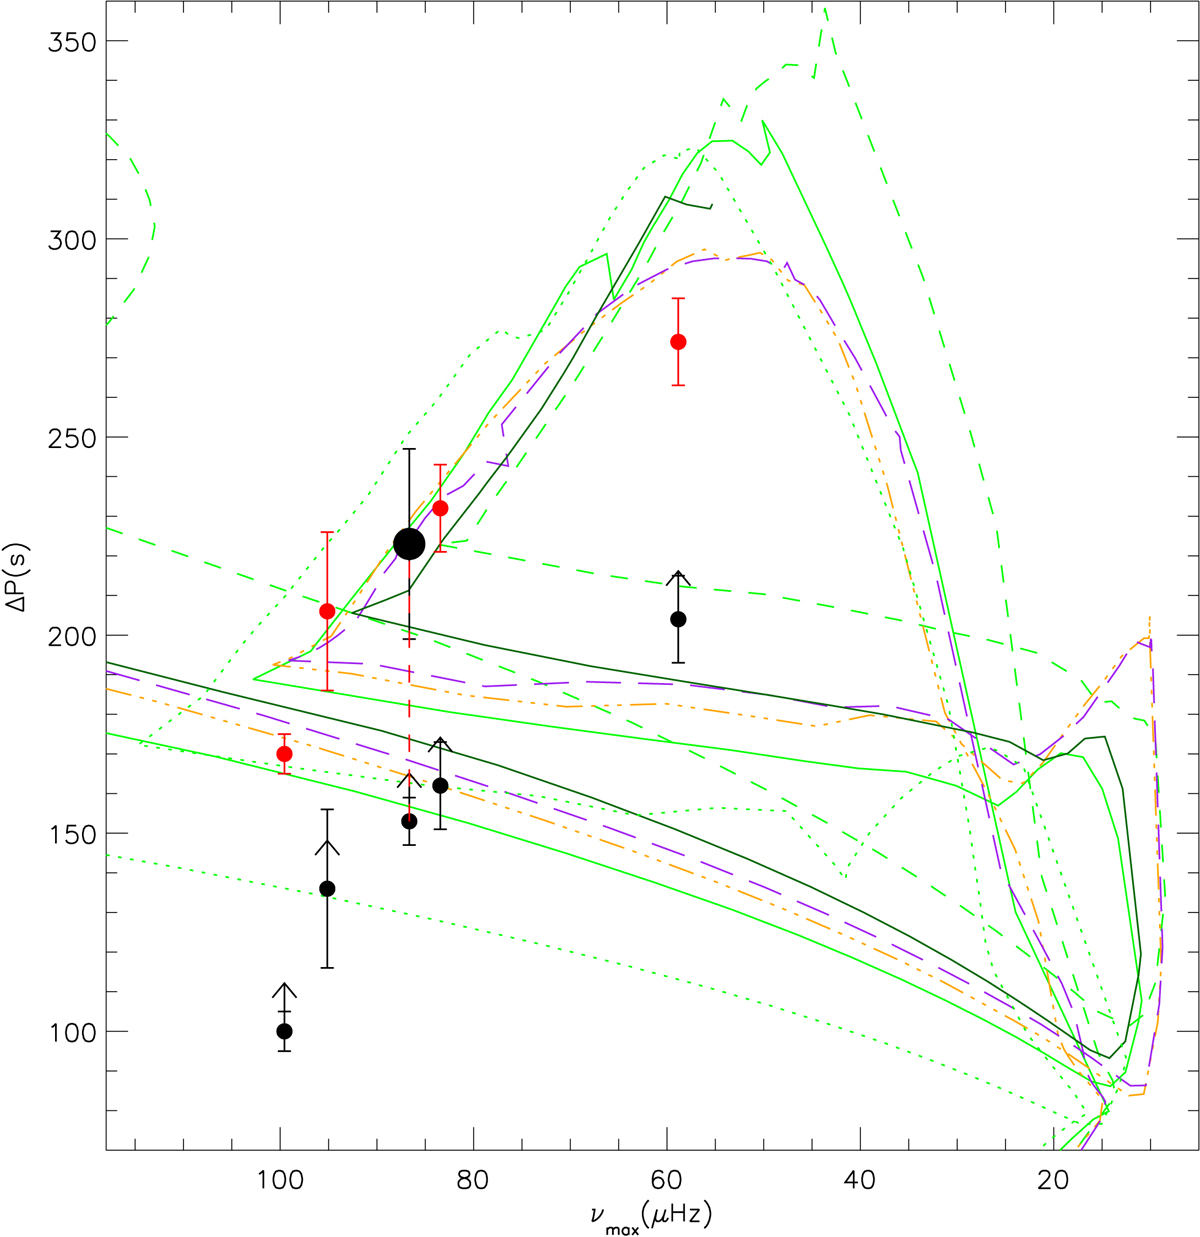
Fig. 6.
Download original image
Predicted and observed period spacings as a function of νmax. Isochrone details are in the text and in legend of Figs. 1 and 7. For clarity, not all isochrones are shown. For reference, the isochrone RGB phase begins on the left-hand side and reaches the RGB tip on the lower right before returning left through the contracting HeCB phase, then taking another shift to the right at the beginning of the stable HeCB phase. This happens at the point (93, 208) for the dark green full-drawn thick 0.43 Gyr isochrone. The black arrows mark the observed period spacings which are extreme lower limits of their asymptotic counterparts. The red dashed line connects the observed and asymptotic period spacing for the one star that has both measurements. The red circles are the observed period spacings shifted by the amount of the red dashed line and represent an approximation of the asymptotic period spacings, assuming that the difference between the observed and asymptotic period spacing is similar for all five stars.
Current usage metrics show cumulative count of Article Views (full-text article views including HTML views, PDF and ePub downloads, according to the available data) and Abstracts Views on Vision4Press platform.
Data correspond to usage on the plateform after 2015. The current usage metrics is available 48-96 hours after online publication and is updated daily on week days.
Initial download of the metrics may take a while.