Fig. 5.
Download original image
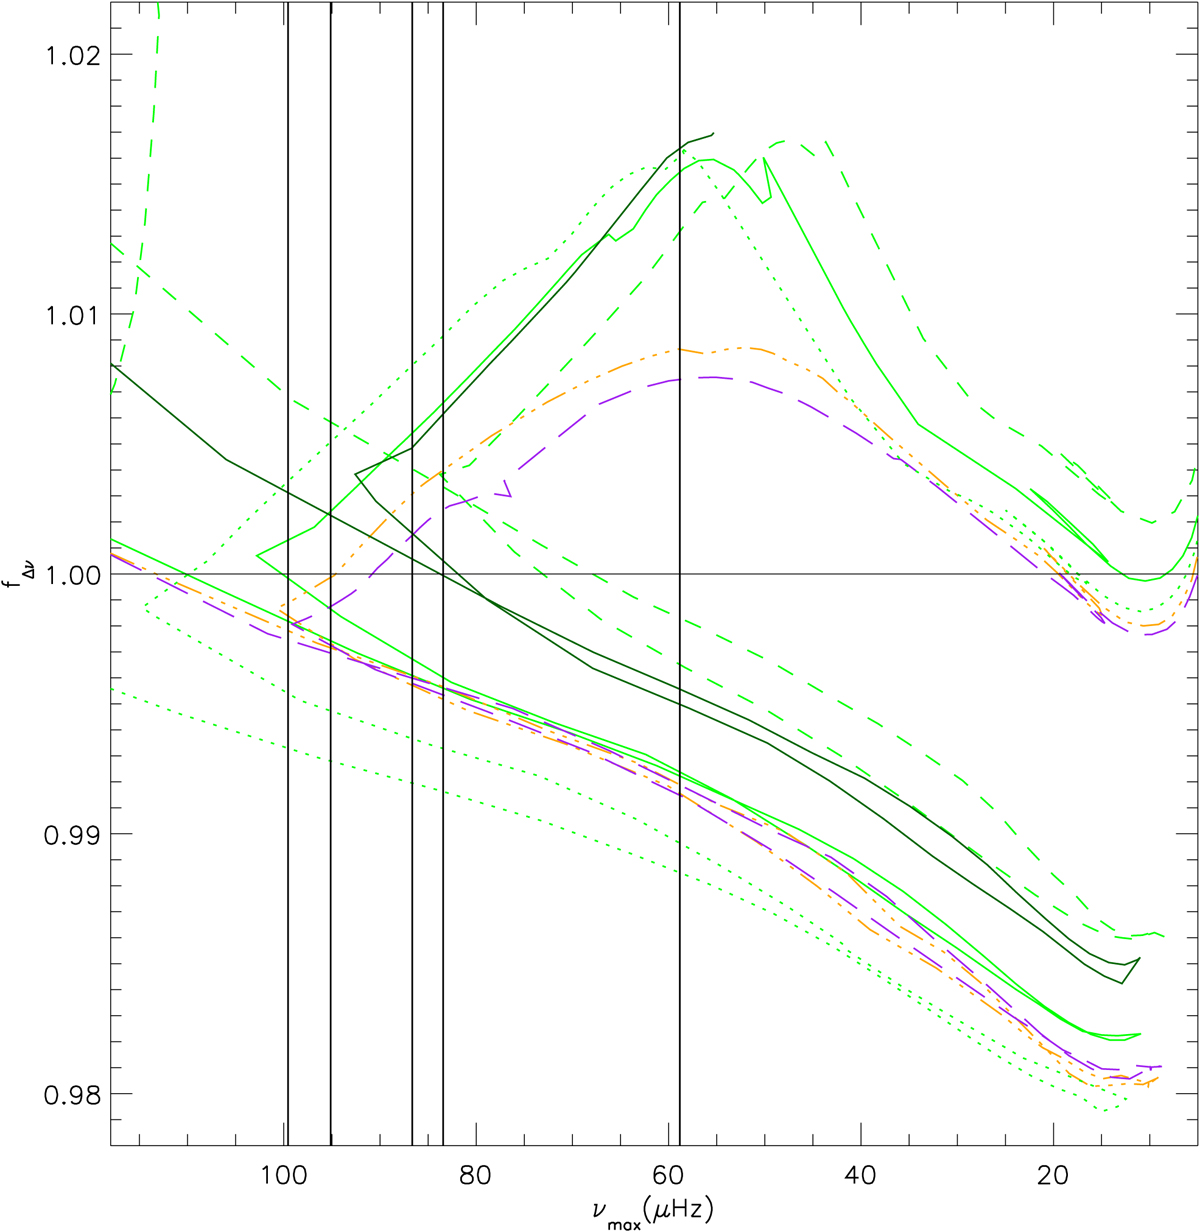
Predicted corrections to Δν as a function of νmax for isochrones with details in the text and in legend of Figs. 1 and 7. For clarity, not all isochrones are shown. For reference, the stable HeCB phase begins approximately at the point (93, 1.004) and continues to the right for the dark green solid 0.43 Gyr isochrone. The vertical black lines mark the measured νmax values for the NGC 6866 giants.
Current usage metrics show cumulative count of Article Views (full-text article views including HTML views, PDF and ePub downloads, according to the available data) and Abstracts Views on Vision4Press platform.
Data correspond to usage on the plateform after 2015. The current usage metrics is available 48-96 hours after online publication and is updated daily on week days.
Initial download of the metrics may take a while.