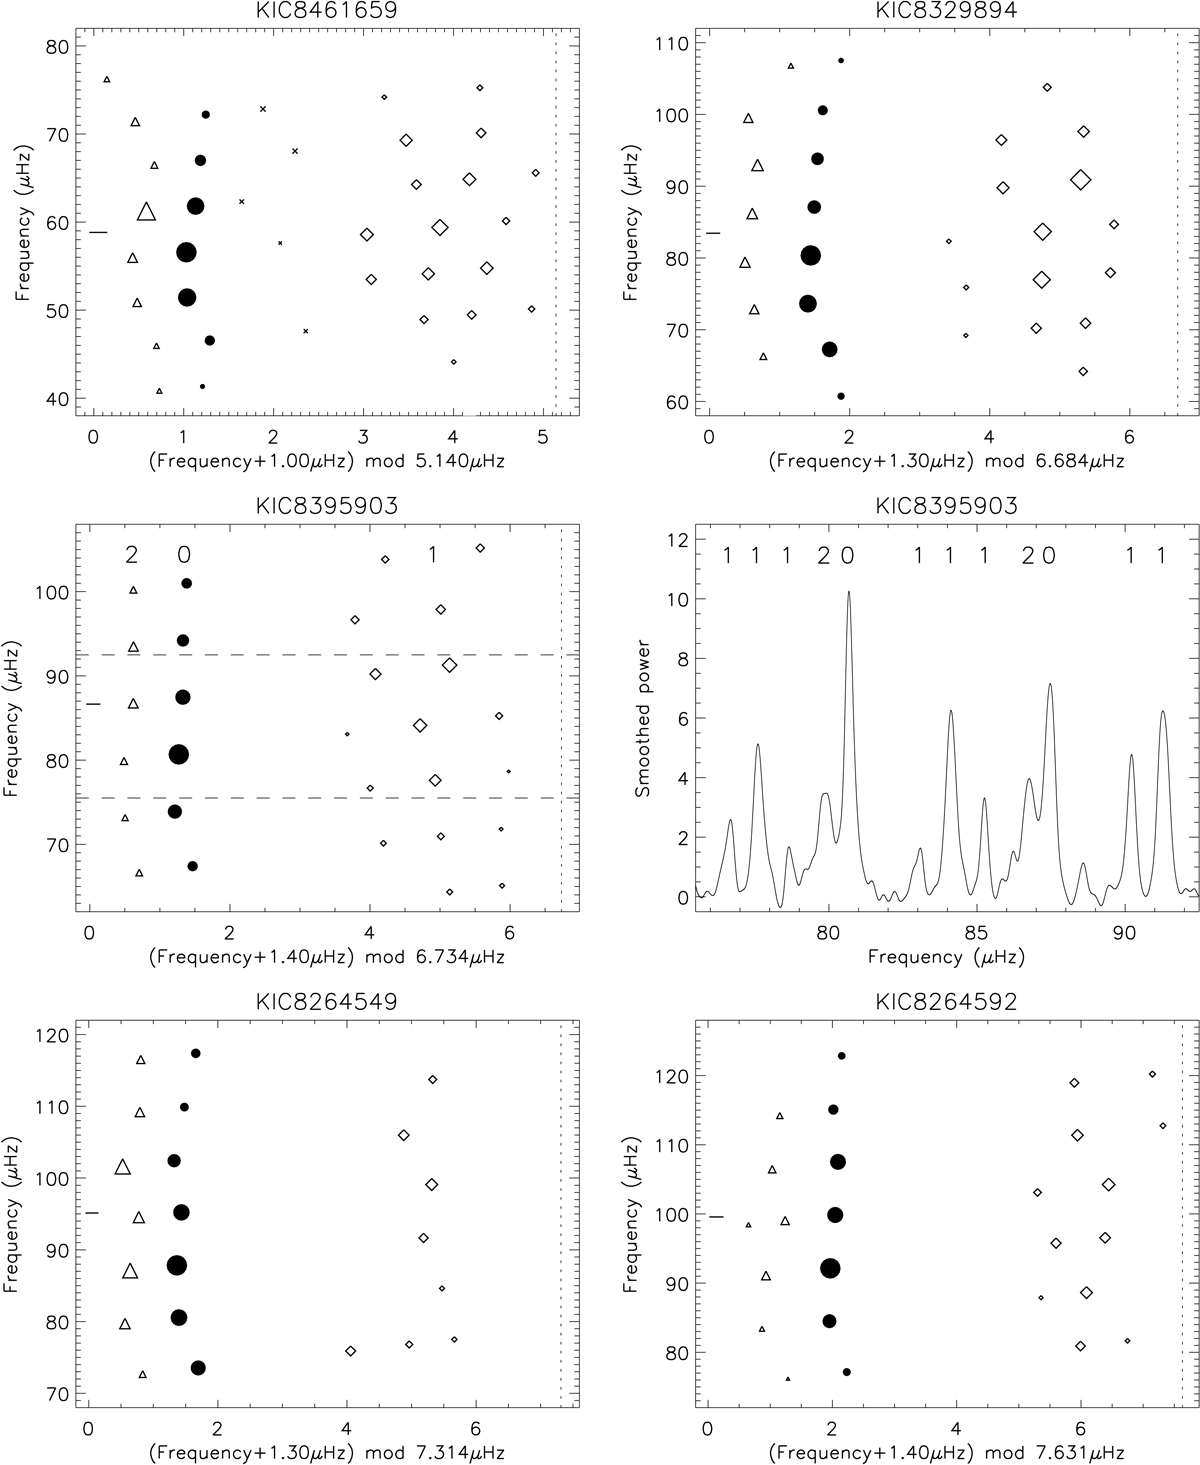
Fig. 4.
Download original image
Echelle diagrams for our five stars, shown in the top and bottom panels, along with the leftmost middle panel. These diagrams show the oscillation frequencies as a function of the same modulo of the frequencies and the large frequency separation, Δν0, which separates modes of different ℓ-value and hence allows for mode identification. The x-axis has in each case been shifted by a constant to place modes of ℓ = 0, 2 on the left side of the diagrams and modes of ℓ = 1 on the right side. Modes of ℓ = 0 are shown as filled circles, ℓ = 1 as diamonds, ℓ = 2 as triangles, and possible ℓ = 3-modes are shown as crosses (upper-left panel only). The frequencies of maximum power (νmax) are indicated as short horizontal lines near the y-axes and the large frequency separations (Δν0) as vertical dashed lines. The middle panels illustrate the relation between the échelle diagram and the power spectrum: in the échelle diagram for KIC 8395903 (middle-left) the horizontal dashed lines indicate the frequency region of the power spectrum shown in the middle-right panel, with the ℓ-values of the oscillation frequencies written at the top of each panel.
Current usage metrics show cumulative count of Article Views (full-text article views including HTML views, PDF and ePub downloads, according to the available data) and Abstracts Views on Vision4Press platform.
Data correspond to usage on the plateform after 2015. The current usage metrics is available 48-96 hours after online publication and is updated daily on week days.
Initial download of the metrics may take a while.