Fig. 3.
Download original image
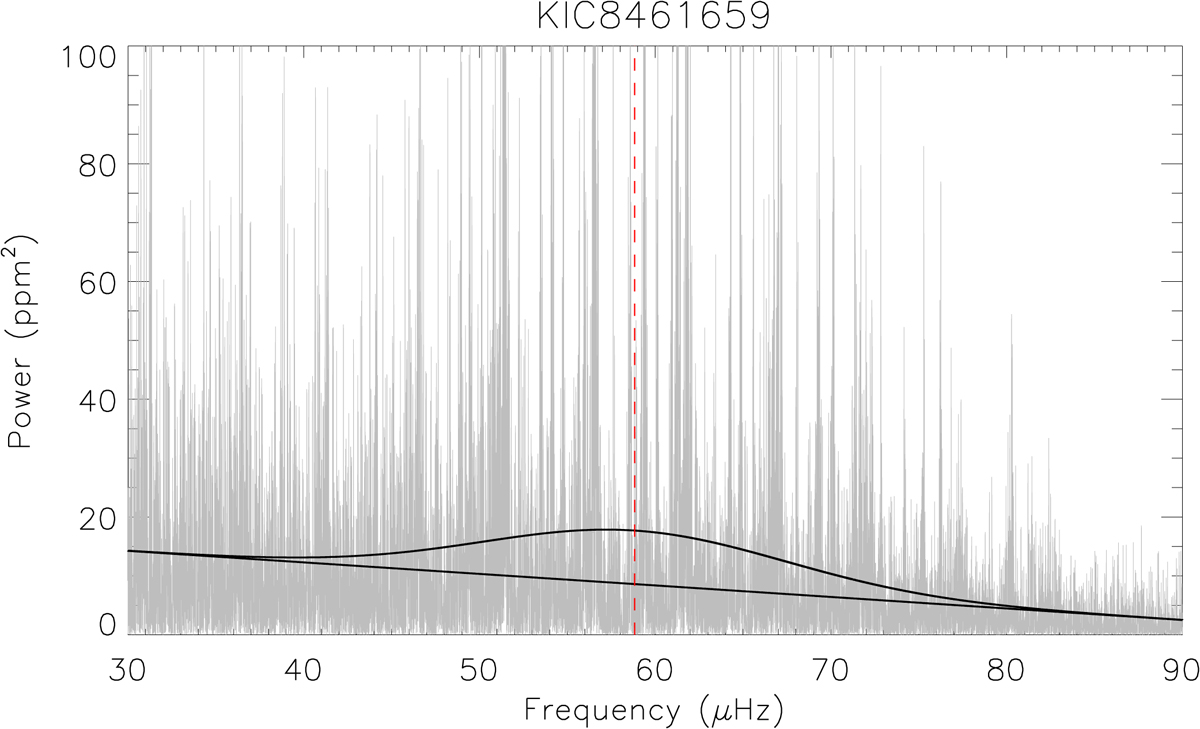
Frequency of maximum power, νmax, is determined from a model including a linear trend and a Gaussian envelope. The linear trend accounts for the stellar background in the frequency region of the oscillations, which increases towards lower frequencies, while the Gaussian envelope fits the solar-like oscillations which follows a Gaussian distribution centered on νmax. The determined value for νmax for the star shown here as an example, KIC 8461659, is indicated by the vertical (red) dashed line, and the underlying, fitted power spectrum is shown in grey.
Current usage metrics show cumulative count of Article Views (full-text article views including HTML views, PDF and ePub downloads, according to the available data) and Abstracts Views on Vision4Press platform.
Data correspond to usage on the plateform after 2015. The current usage metrics is available 48-96 hours after online publication and is updated daily on week days.
Initial download of the metrics may take a while.