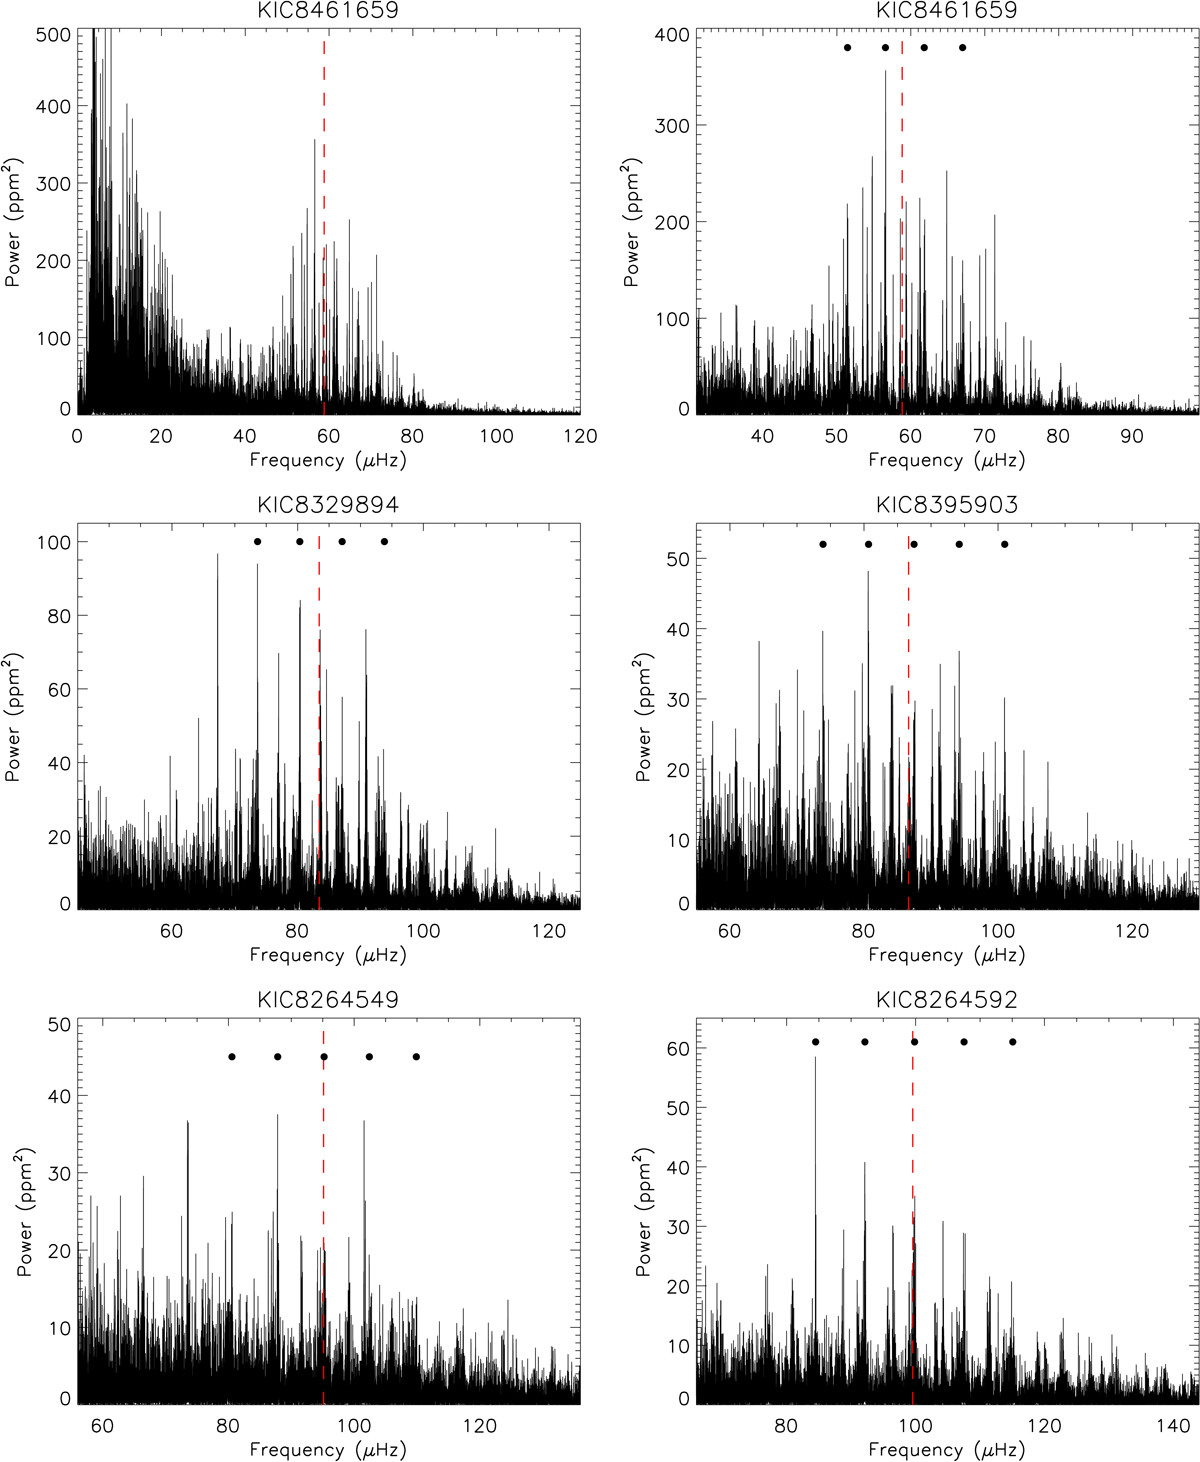
Fig. 2.
Download original image
Power spectra of the five target stars, with the spectrum of one of them, KIC 8461659, shown twice in the upper panels: one version (upper-left) which extends to low frequencies, and one version (upper-right) focussing on the frequency region of the oscillations. The effect of the filtering in the preparation of the light curve can be seen in the leftmost version of these, where the power drops off at low frequencies. We only show the version focused on the oscillations for the remaining four stars. The frequency of maximum power, νmax, is indicated in each panel as a (red) vertical dashed line. The filled circles indicate the position of the 4–5 dominating ℓ = 0-modes near νmax. Due to the stochastic nature of the oscillations, each mode is represented by a series of close peaks, which is the reason why the detailed frequency analysis is performed using smoothed versions of the power spectra (see text).
Current usage metrics show cumulative count of Article Views (full-text article views including HTML views, PDF and ePub downloads, according to the available data) and Abstracts Views on Vision4Press platform.
Data correspond to usage on the plateform after 2015. The current usage metrics is available 48-96 hours after online publication and is updated daily on week days.
Initial download of the metrics may take a while.