Fig. 6.

Download original image
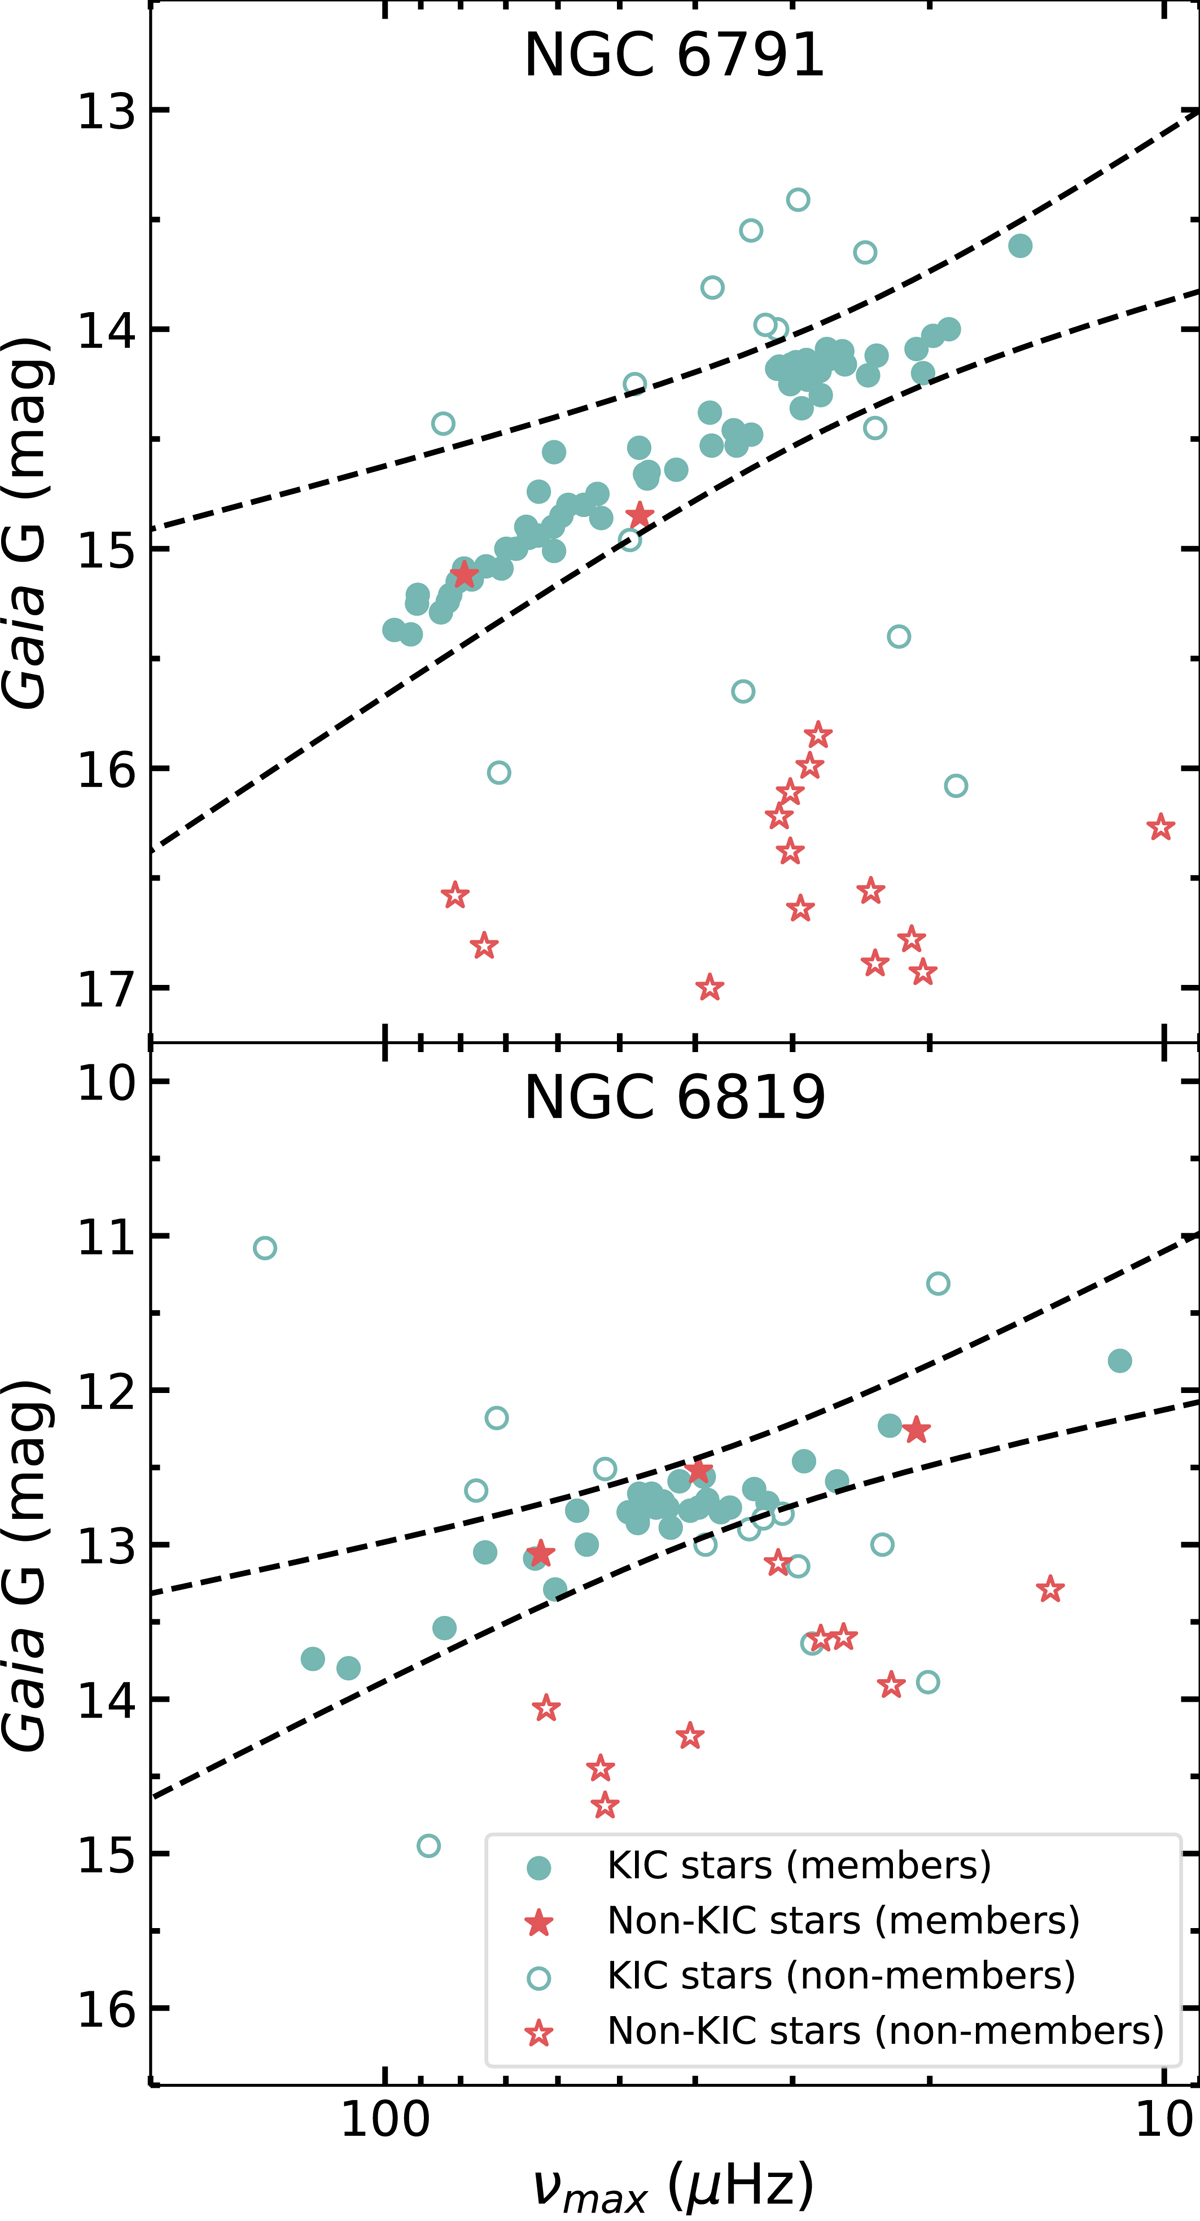
Gaia G magnitude vs. frequency of the maximum oscillation power νmax for red giants in NGC 6791 and NGC 6819. Dots are KIC stars, and star symbols are newly detected stars. Filled symbols are likely to be cluster members, and open symbols are nonmembers. The axes are oriented to make the plot similar to a color-magnitude diagram. The dashed lines show the regions in which cluster stars tend to line up in these diagrams and their 95% confidence intervals.
Current usage metrics show cumulative count of Article Views (full-text article views including HTML views, PDF and ePub downloads, according to the available data) and Abstracts Views on Vision4Press platform.
Data correspond to usage on the plateform after 2015. The current usage metrics is available 48-96 hours after online publication and is updated daily on week days.
Initial download of the metrics may take a while.


