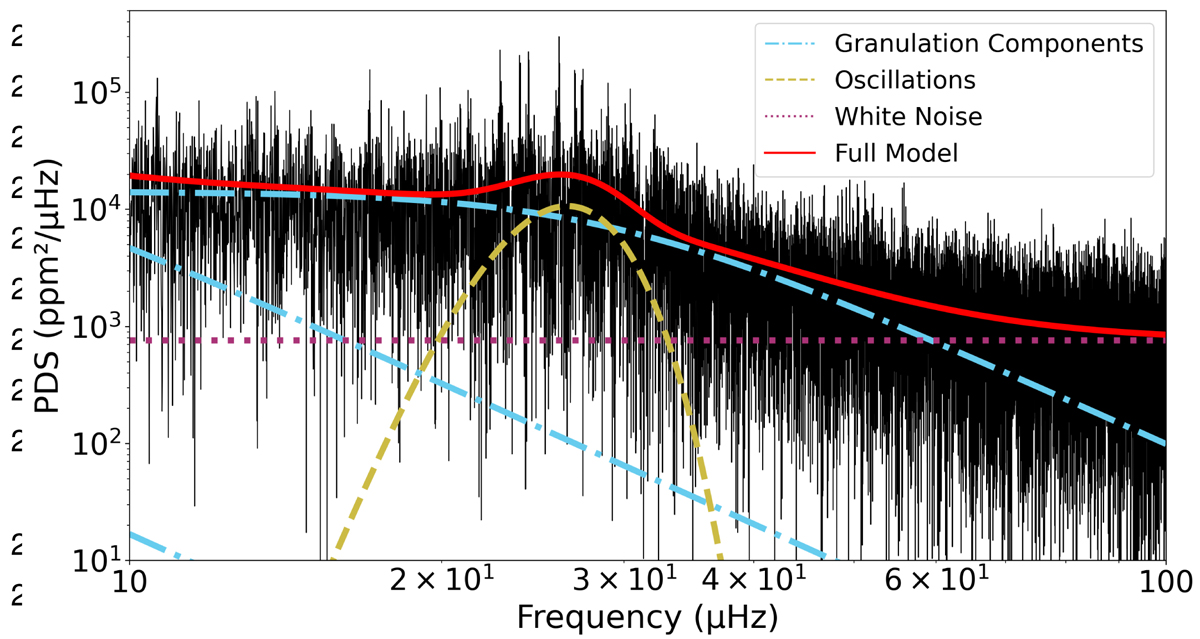
Fig. 4.
Download original image
Power density spectrum (in black) of one of the target stars in NGC 6791 (star 39 in Table 1). The solid red line shows the global model fit computed by TACO, which includes three granulation components (dashed blue lines), one white-noise component (horizontal dotted magenta line), and a Gaussian fit to the oscillation power excess (dashed yellow line).
Current usage metrics show cumulative count of Article Views (full-text article views including HTML views, PDF and ePub downloads, according to the available data) and Abstracts Views on Vision4Press platform.
Data correspond to usage on the plateform after 2015. The current usage metrics is available 48-96 hours after online publication and is updated daily on week days.
Initial download of the metrics may take a while.