Fig. 8.
Download original image
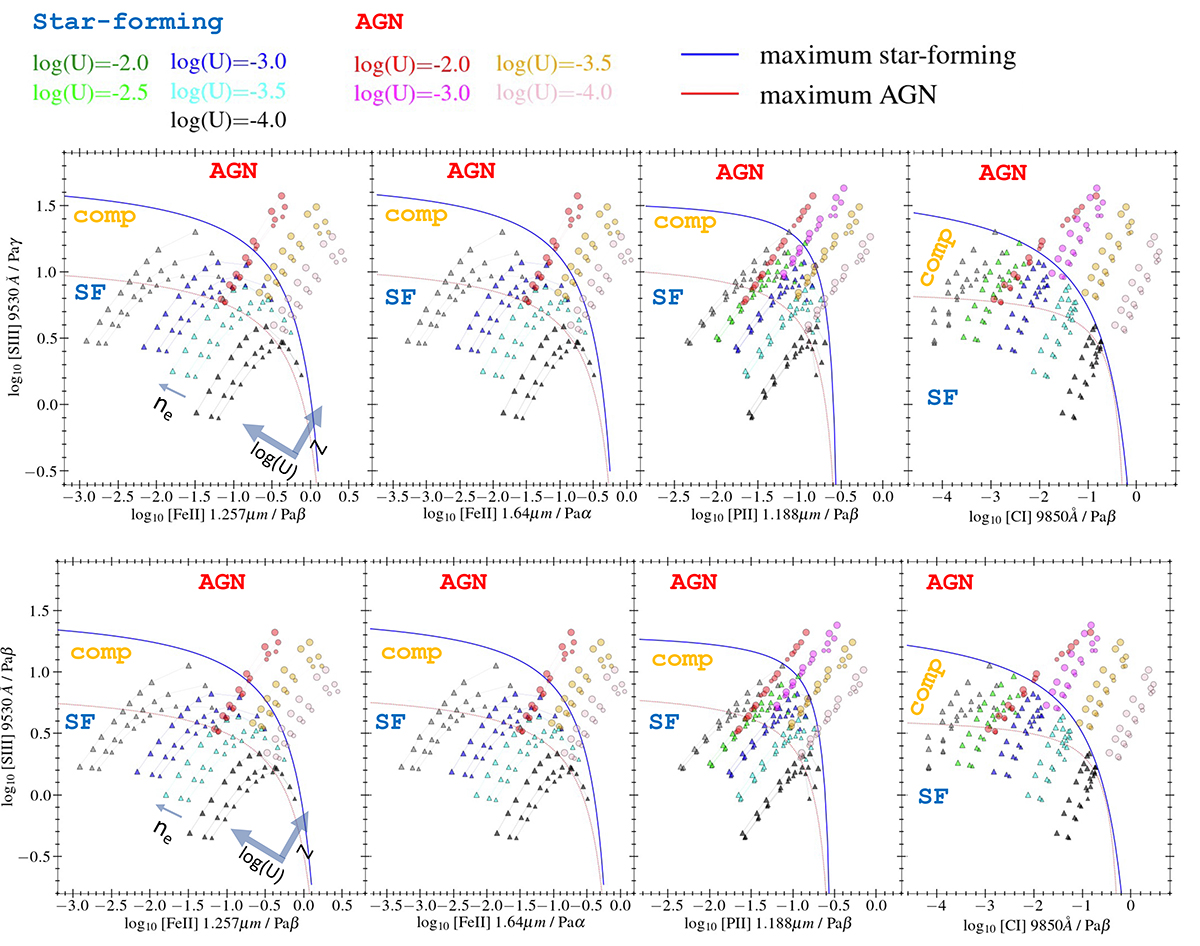
Near-IR diagnostic diagrams analyzed in this paper: Top row: [S III]/Paγ as a function of [Fe II]/Paβ (Fe2S3–β), [Fe II]/Paα (Fe2S3–α), [P II]/Paβ (P2S3), and [C I]/Paβ (C1S3). AGN models are represented as circles, colored as a function of log(U), and with sizes increasing with density. Star-forming models are the triangle symbols. The maximum AGN line and the maximum starburst separation limit are defined by a dotted red line and a continuous blue line, respectively. Bottom row: same as above but as a function of the [S III]/Paβ line ratio on the y-axis.
Current usage metrics show cumulative count of Article Views (full-text article views including HTML views, PDF and ePub downloads, according to the available data) and Abstracts Views on Vision4Press platform.
Data correspond to usage on the plateform after 2015. The current usage metrics is available 48-96 hours after online publication and is updated daily on week days.
Initial download of the metrics may take a while.