Fig. 7.
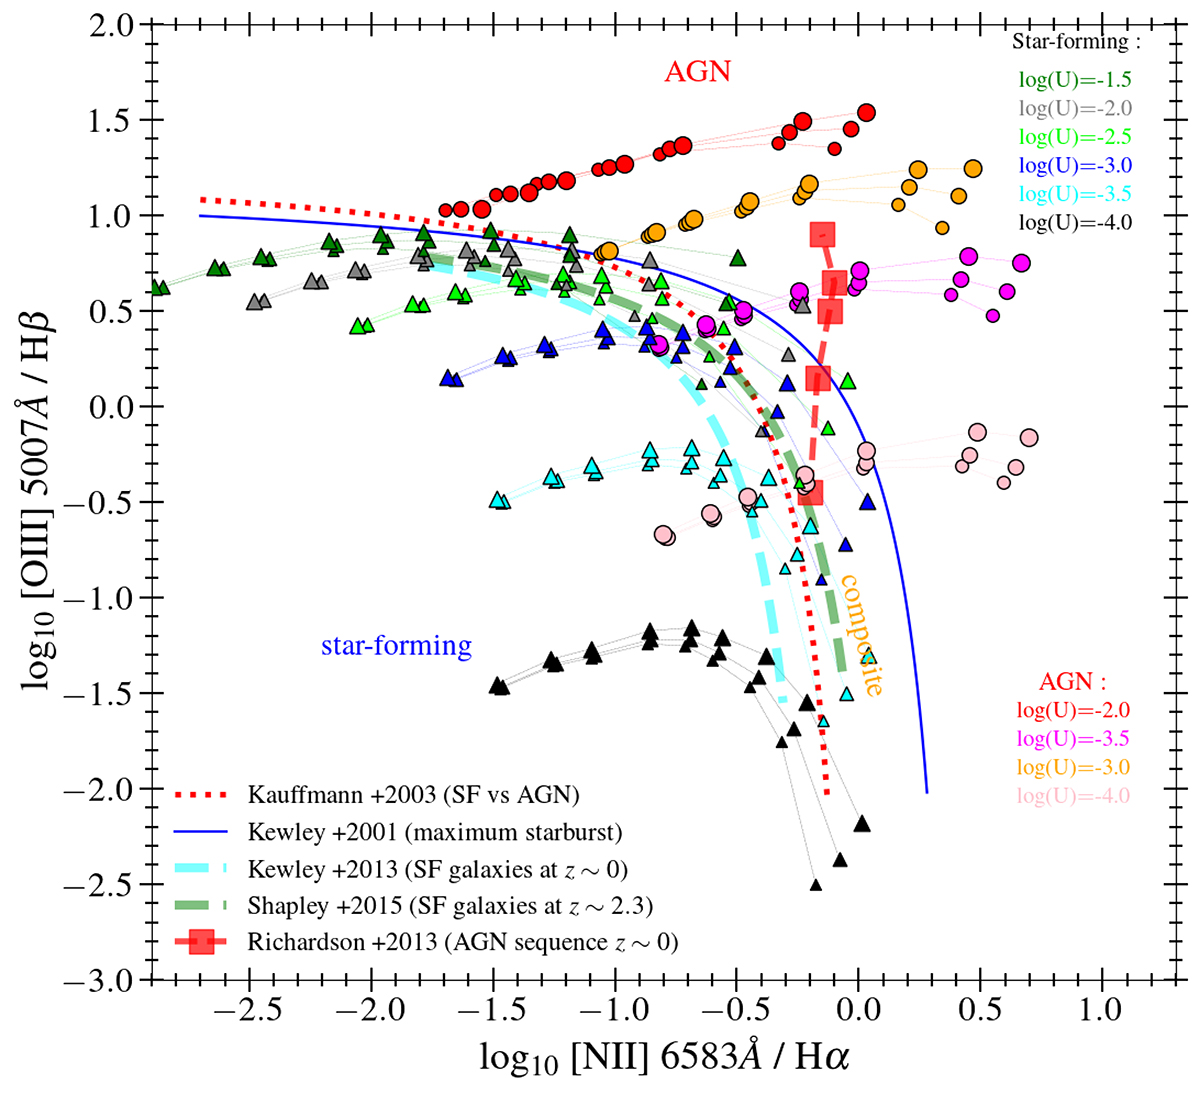
Download original image
Prediction from our Cloudy models of the emission line ratios [O III]/Hβ vs [N II]/Hα (BPT diagram). Triangles and circles represent the star-forming and AGN models, respectively. The gas-phase metallicity increases from left to right. The blue continuous line represents the separation line by Kauffmann et al. (2003), while the red dotted line represents the maximum starburst model by Kewley et al. (2001). The cyan and green dashed lines show the average location of star-forming galaxies at z = 0 and z = 2.3, respectively, from Kewley et al. (2013) and Shapley et al. (2015). The big red squares and dashed line highlight the AGN sequence by Richardson et al. (2014), with increasing ionization from bottom to top.
Current usage metrics show cumulative count of Article Views (full-text article views including HTML views, PDF and ePub downloads, according to the available data) and Abstracts Views on Vision4Press platform.
Data correspond to usage on the plateform after 2015. The current usage metrics is available 48-96 hours after online publication and is updated daily on week days.
Initial download of the metrics may take a while.