Fig. 6.
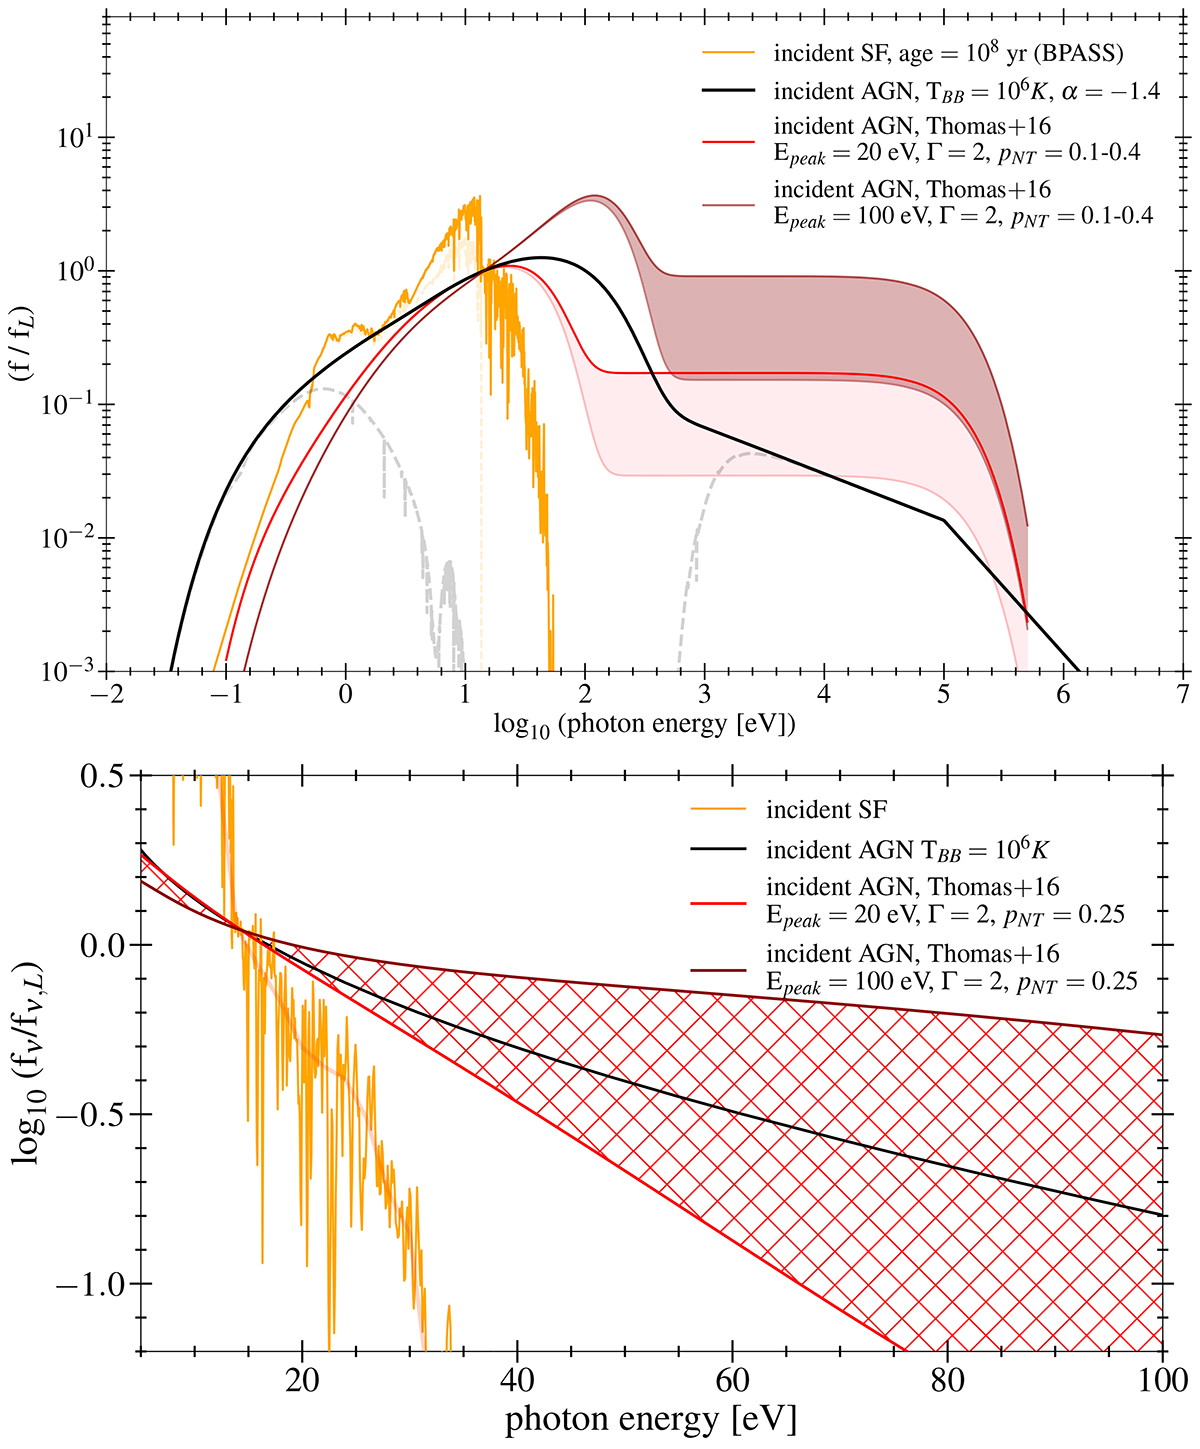
Download original image
Top: diagram with the shape of the ionizing radiation field (energy units, normalized to the flux at the Lyman limit) assumed in CLOUDY to model the stellar emission (orange curve) and the AGN emission (black, red, and darkred curves, as described in the legend). For these representative curves we have assumed log(U) = − 2, solar metallicity, and a density of 103 cm−3 in all cases. In the AGN models from Thomas et al. (2016), we identify with the same color (red or darkred) the family with a common Epeak, in which the parameter pNT increases toward the top from the lighter to the darker line. The dashed shaded lines indicate the transmitted continuum. Bottom: zoom-in of the top panel in the energy range between 5 and 100 eV, but with a linear scale on the x-axis and the flux density fν (normalized to the flux density at the Lyman limit) on the y-axis. This version of the plot is inspired by Feltre et al. (2016). The area between the two AGN shapes of Thomas et al. (2016) with the same pNT = 0.25 and varying Epeak (in the range 20 − 100 eV) is filled with a chequered red pattern.
Current usage metrics show cumulative count of Article Views (full-text article views including HTML views, PDF and ePub downloads, according to the available data) and Abstracts Views on Vision4Press platform.
Data correspond to usage on the plateform after 2015. The current usage metrics is available 48-96 hours after online publication and is updated daily on week days.
Initial download of the metrics may take a while.