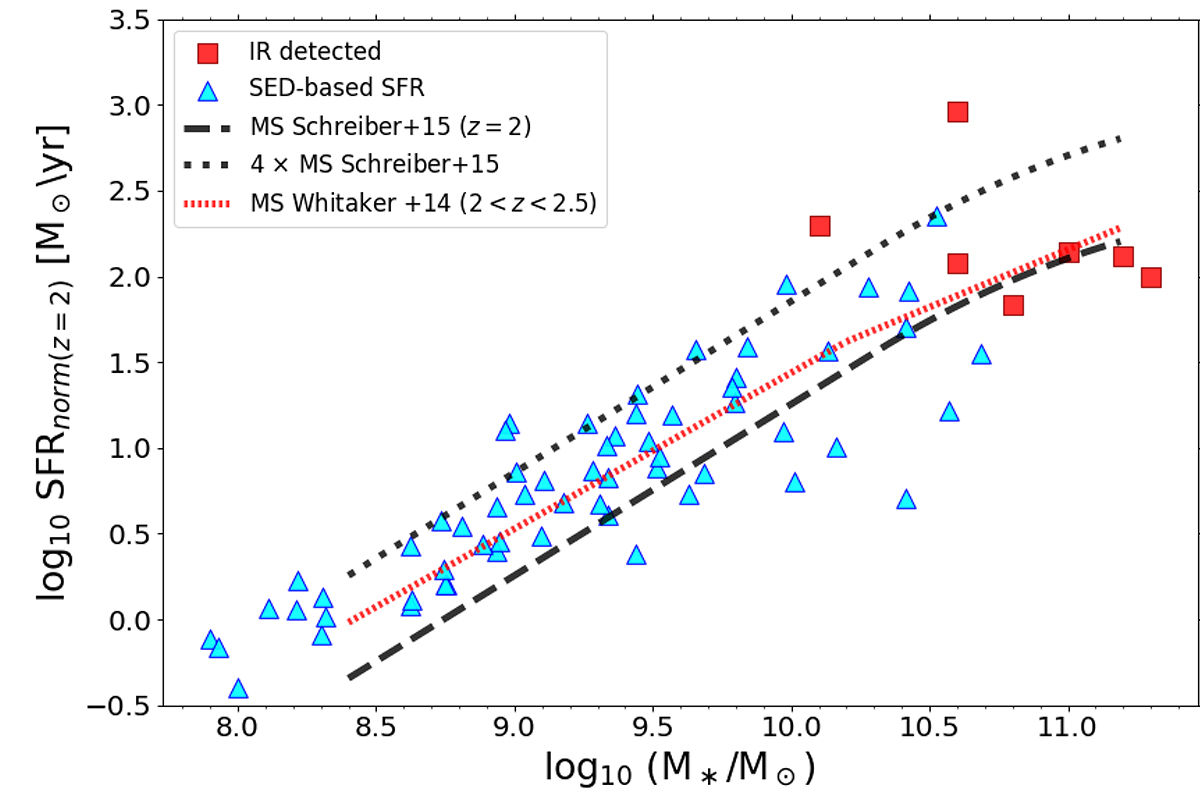
Fig. 5.
Download original image
Stellar mass M⋆–SFR diagram of CEERS galaxies selected in this work between redshift 1 and 3. The M⋆ and SFR are taken from Stefanon et al. (2017) as described in the text (cyan triangles) or from Le Bail et al. (in prep.) if Herschel detected (red squares). The sample is representative of the star-forming Main Sequence (MS) at the median redshift of the sample (zmedian = 2). The black dotted line represents the starburst limit, that is, a factor of 4 above the MS of Schreiber et al. (2015). The SFRs shown in this plot are normalized to z = 2 assuming that they scale with redshift as (1 + z)2.8 (Sargent et al. 2014).
Current usage metrics show cumulative count of Article Views (full-text article views including HTML views, PDF and ePub downloads, according to the available data) and Abstracts Views on Vision4Press platform.
Data correspond to usage on the plateform after 2015. The current usage metrics is available 48-96 hours after online publication and is updated daily on week days.
Initial download of the metrics may take a while.