Fig. 2.
Download original image
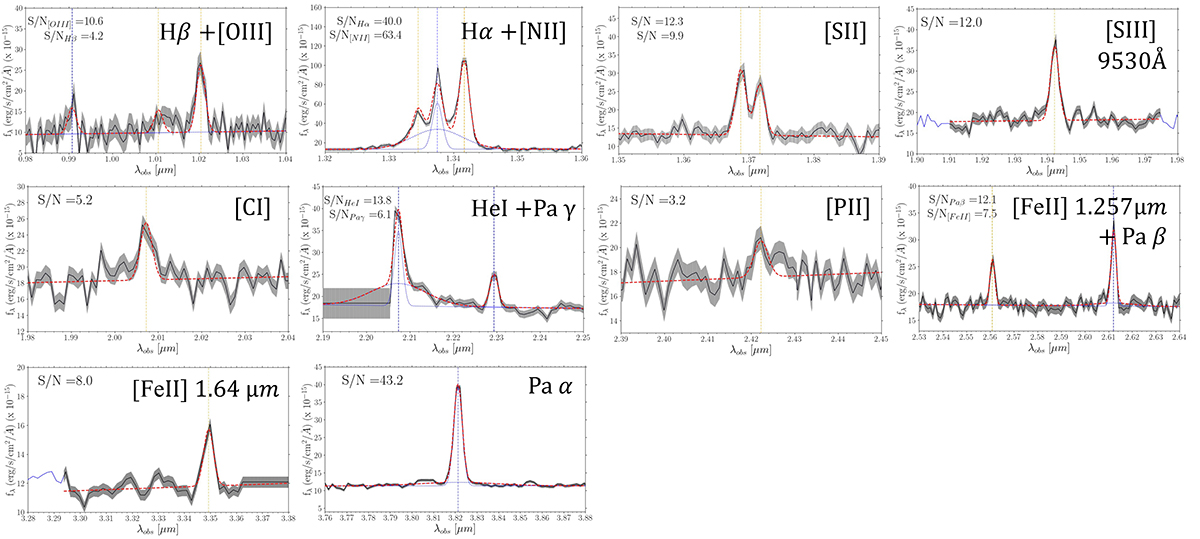
Spectrum of the broad-line AGN with CEERS ID 3129 at z = 1.04, around emission lines detected in the full spectral range of NIRSpec, in increasing order of wavelength. The noise spectrum is represented with gray error bars around the observed flux (black line). The emission lines are fitted with multiple Gaussian components, as described in the text. Blue and orange vertical dashed lines highlight the gaussian central wavelength of permitted and forbidden lines, respectively. For broad lines, both the narrow and broad components are shown with a dashed and dotted blue line, respectively. The global best fit profile is drawn with a red dashed line. The S/N of the detection is highlighted in the top left corner of each panel, while the name of each line is written in the top right corner (see also Table 1).
Current usage metrics show cumulative count of Article Views (full-text article views including HTML views, PDF and ePub downloads, according to the available data) and Abstracts Views on Vision4Press platform.
Data correspond to usage on the plateform after 2015. The current usage metrics is available 48-96 hours after online publication and is updated daily on week days.
Initial download of the metrics may take a while.