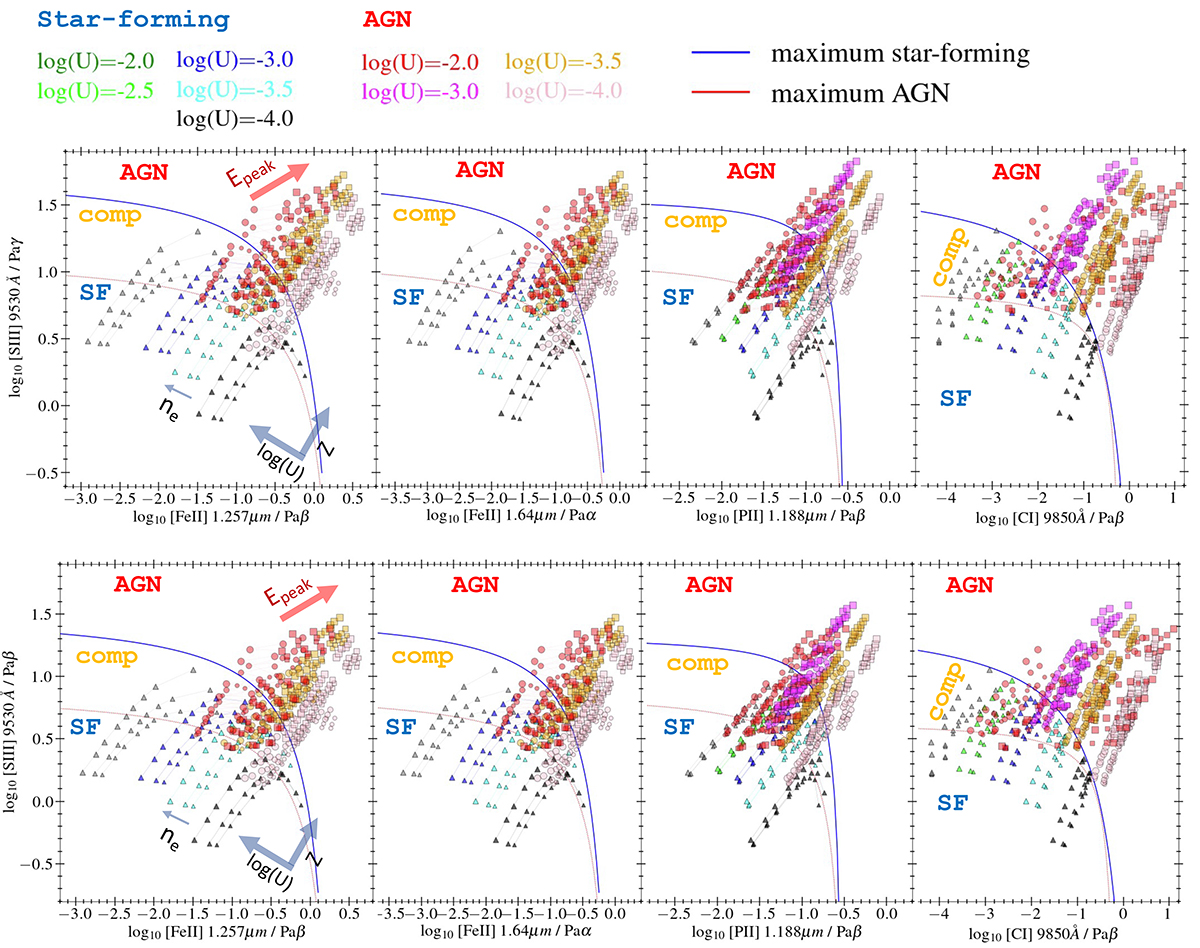
Fig. B.2.
Download original image
Near-IR diagnostic diagrams including Fe2S3-β, Fe2S3-α, P2S3, and C1S3. This figure is the analog of Fig. 8, but the emission line predictions for the NLR of AGNs are obtained using the AGN models described in Thomas et al. (2016, 2018). The markers, sizes, and colors of AGN models are the same as described in Fig. B.1. The star-forming models are the same as in Fig. 8. The maximum starburst and AGN lines are defined in Section 4.1 and in Table 6.
Current usage metrics show cumulative count of Article Views (full-text article views including HTML views, PDF and ePub downloads, according to the available data) and Abstracts Views on Vision4Press platform.
Data correspond to usage on the plateform after 2015. The current usage metrics is available 48-96 hours after online publication and is updated daily on week days.
Initial download of the metrics may take a while.