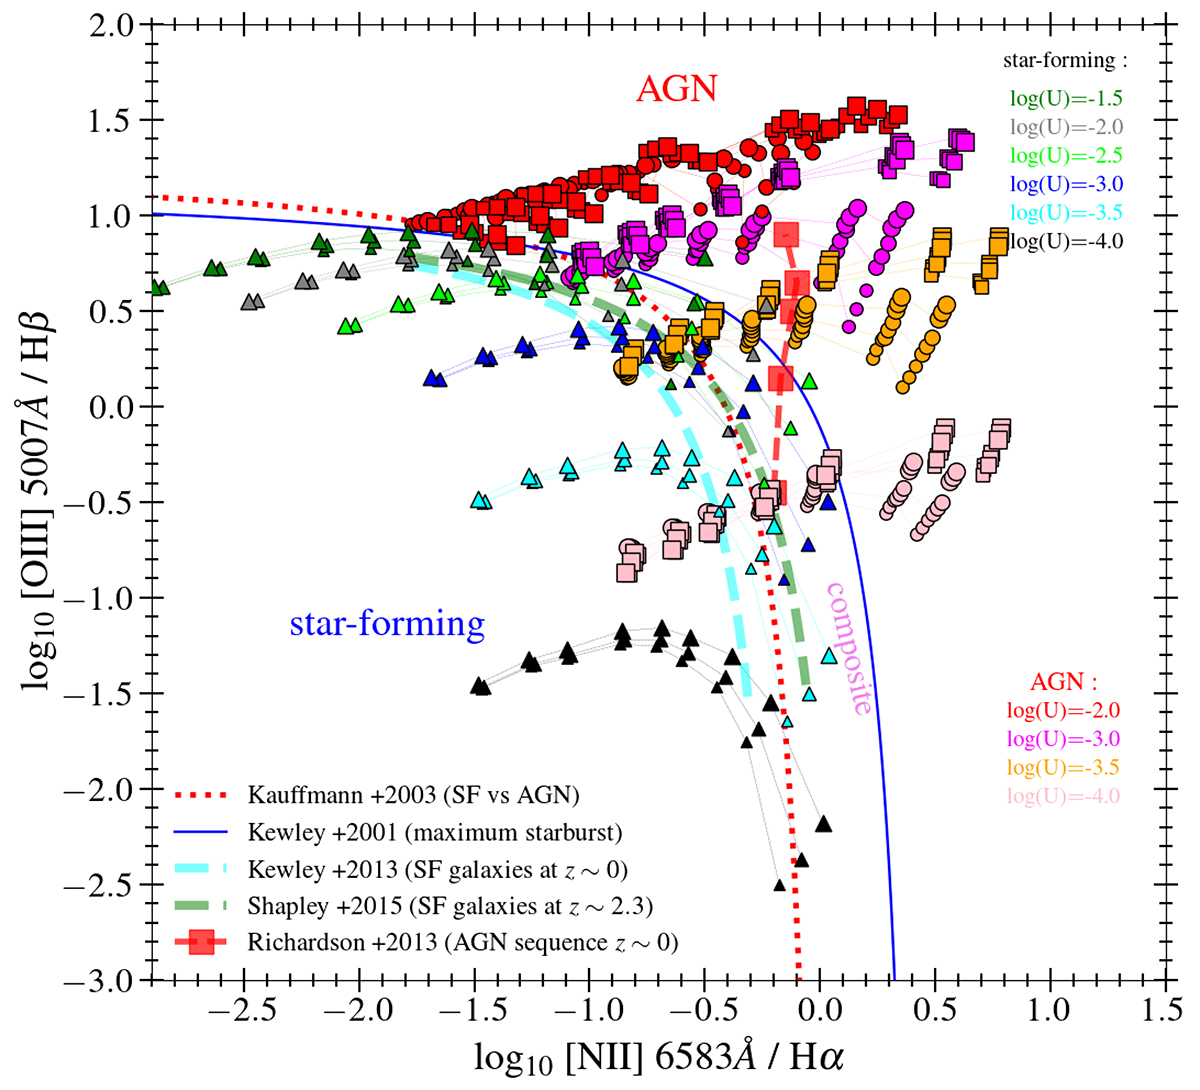
Fig. B.1.
Download original image
BPT diagram, analog of Fig. 7, where the line ratio predictions for AGNs are obtained using the recent models of Thomas et al. (2016, 2018). For AGN models with the same ionization parameter (colored as indicated in the legend), the circles are the predictions obtained with Epeak = 20 eV, while the square symbols are derived assuming Epeak = 100 eV. The marker size varies as a function of gas density (from 102 to 104 cm−3 from the smaller to the larger). The three points with the same marker, size, and color, are the predictions of three different values of pNT: 0.1, 0.25, and 0.4. The lines, markers, and colors for the star-forming models and observations are the same as in Fig. 7.
Current usage metrics show cumulative count of Article Views (full-text article views including HTML views, PDF and ePub downloads, according to the available data) and Abstracts Views on Vision4Press platform.
Data correspond to usage on the plateform after 2015. The current usage metrics is available 48-96 hours after online publication and is updated daily on week days.
Initial download of the metrics may take a while.