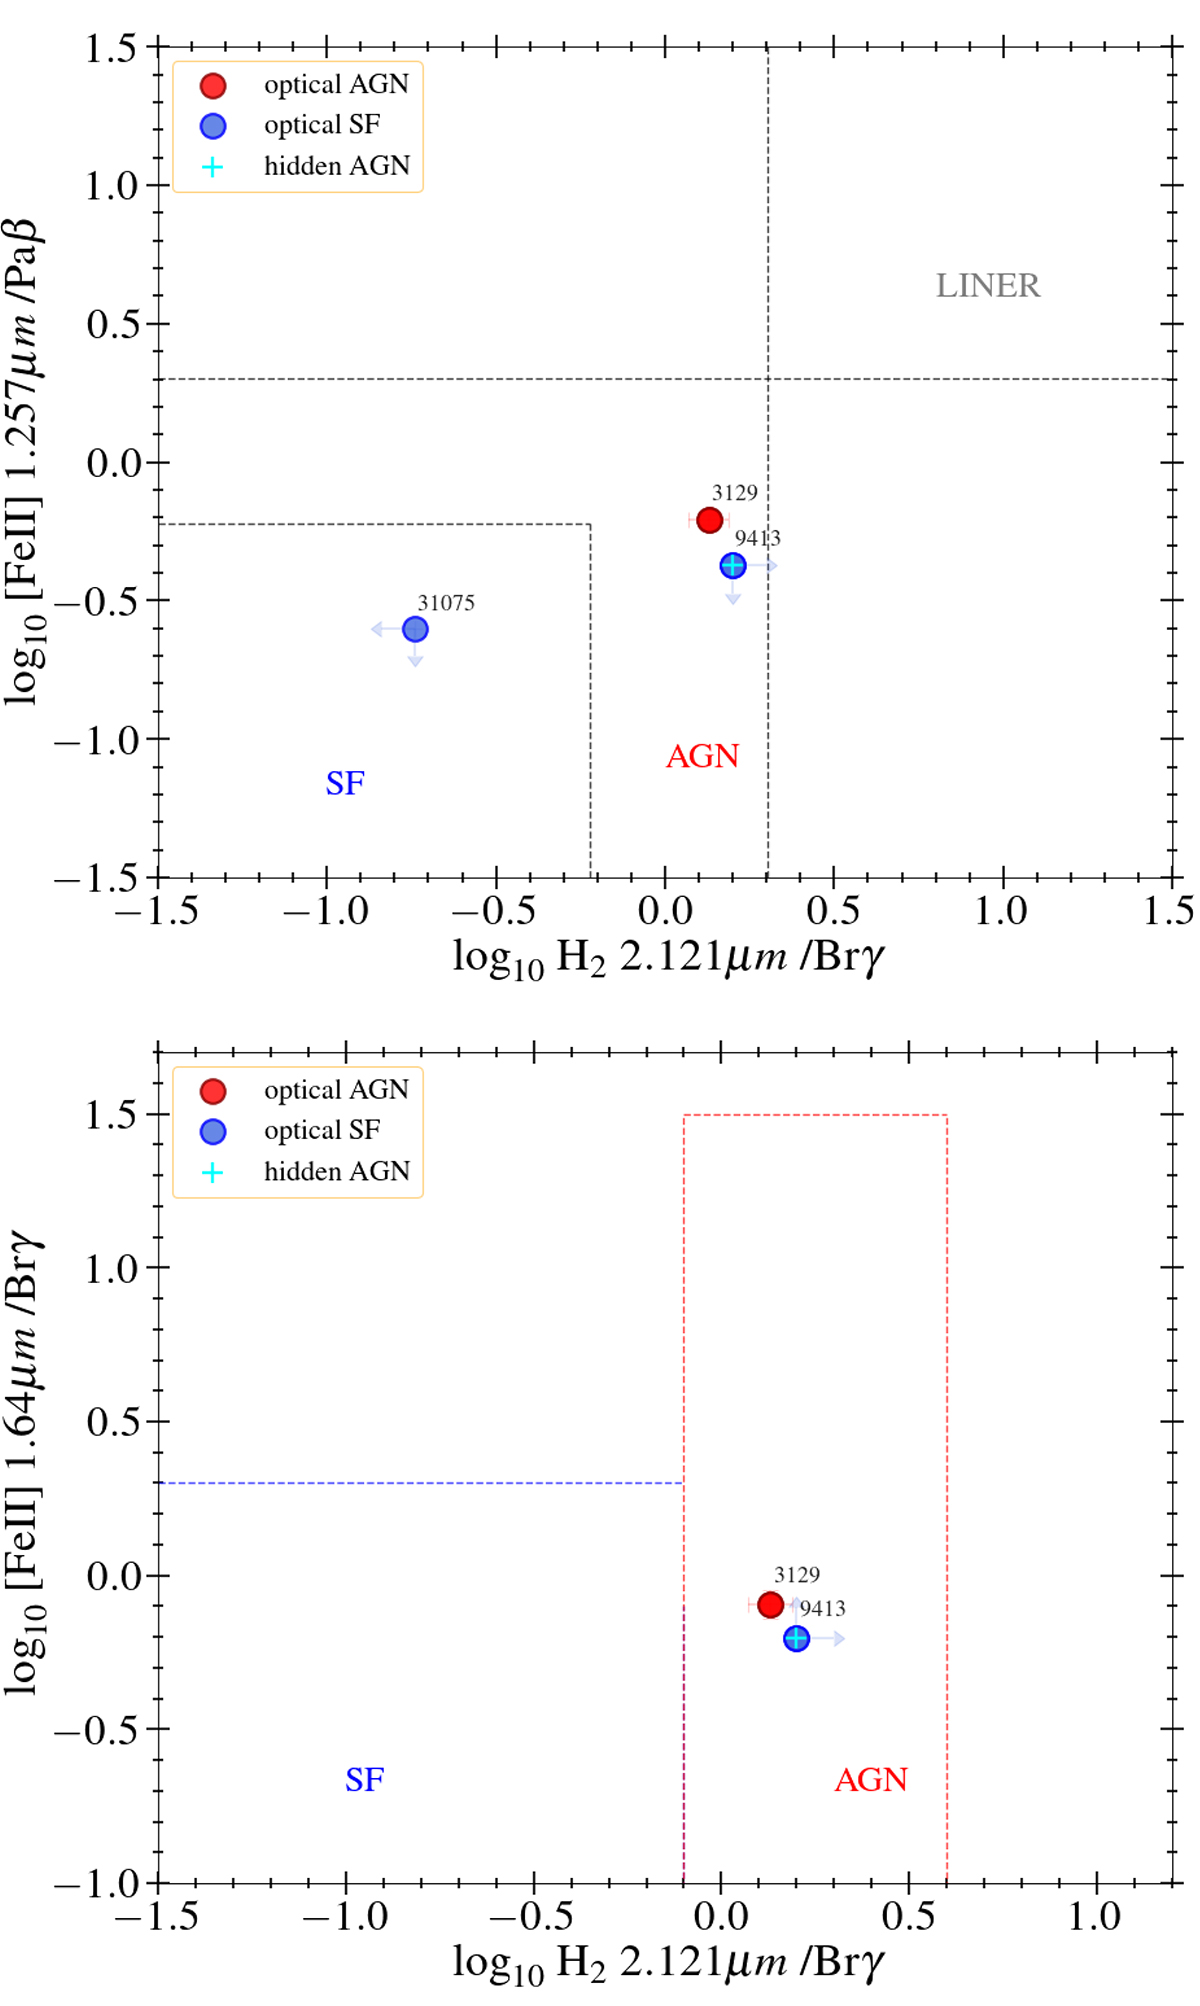
Fig. 14.
Download original image
Top: diagnostic diagram comparing the [Fe II] λ1.257 μm/Paβ and H2λ2.121 μm/Brγ line ratios for CEERS galaxies in the redshift range 1 < z < 1.4 with detection of either H2 or Brγ. The black dashed lines represent the separation lines to distinguish among star-forming sources, AGN, and LINERs, according to Rodríguez-Ardila et al. (2005). Bottom: [Fe II] λ1.64 μm/Brγ vs H2λ2.121 μm/Brγ diagram (Colina et al. 2015) for the same sample.
Current usage metrics show cumulative count of Article Views (full-text article views including HTML views, PDF and ePub downloads, according to the available data) and Abstracts Views on Vision4Press platform.
Data correspond to usage on the plateform after 2015. The current usage metrics is available 48-96 hours after online publication and is updated daily on week days.
Initial download of the metrics may take a while.