Open Access
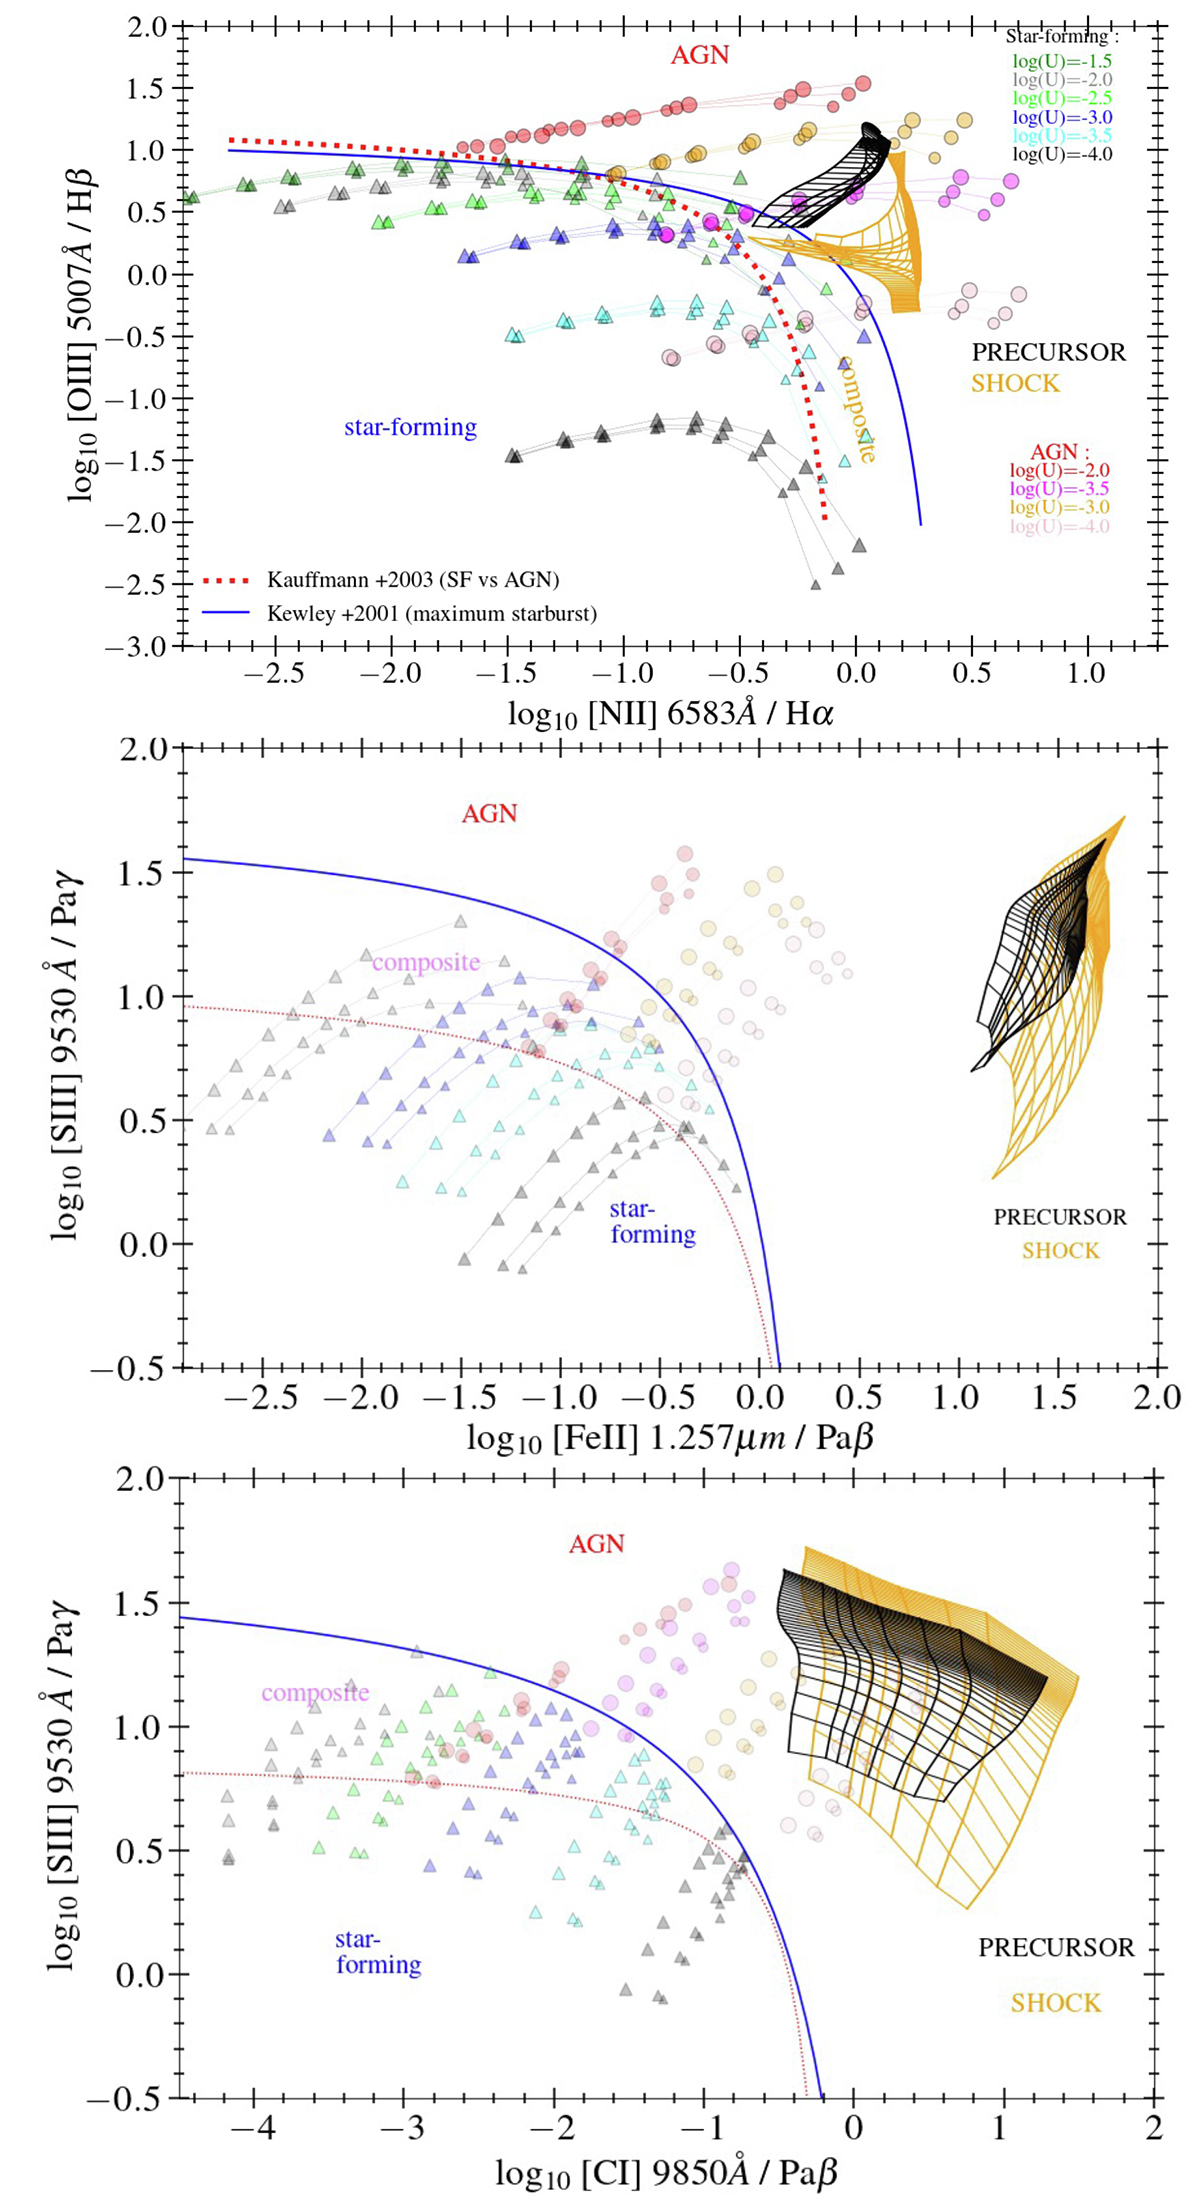
Fig. 13.
Download original image
Predictions of the shock models described in the text for the BPT diagram, the Fe2S3–β, and the C1S3 diagrams, from top to bottom. The AGN and SF models from Cloudy and the separation lines are the same as in Fig. 8.
Current usage metrics show cumulative count of Article Views (full-text article views including HTML views, PDF and ePub downloads, according to the available data) and Abstracts Views on Vision4Press platform.
Data correspond to usage on the plateform after 2015. The current usage metrics is available 48-96 hours after online publication and is updated daily on week days.
Initial download of the metrics may take a while.