Fig. 1.
Download original image
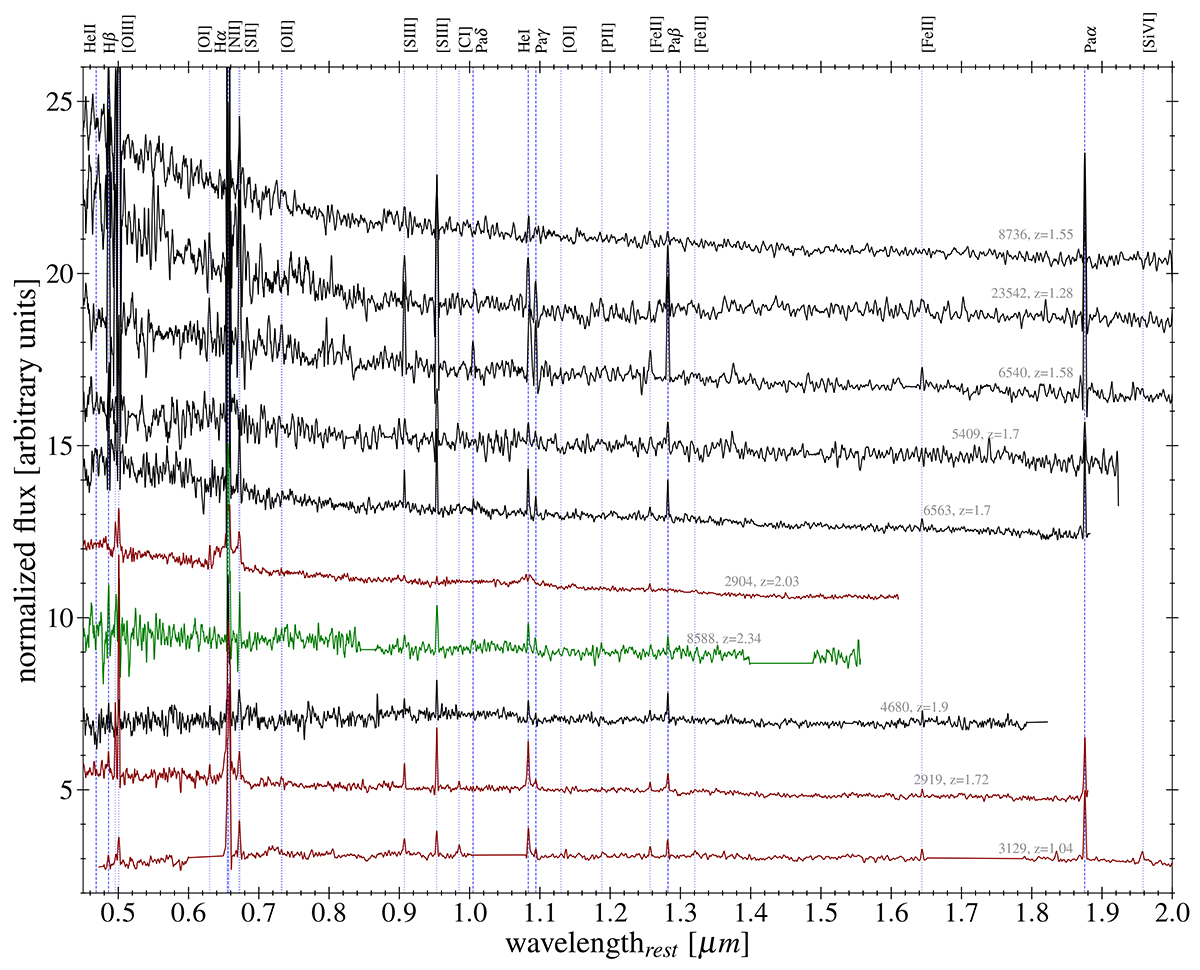
Rest-frame spectra of 10 sources observed by JWST/NIRSpec in CEERS. The spectra are normalized to their median flux and offset relative to each other to help the visualization. They are colored in black, red, and green, according to whether they are identified, respectively, as optical+near-IR star-forming, optical+near-IR AGN, or hidden AGN (i.e., optical SF and near-IR AGN), according to the diagnostic diagrams presented in this paper (see Sect. 4.3). The CEERS ID and the spectroscopic redshift of each source are written besides each spectrum. The emission lines that can be identified in the range 0.4 μm < λ < 2 μm are highlighted above the top axis (see also Table 1).
Current usage metrics show cumulative count of Article Views (full-text article views including HTML views, PDF and ePub downloads, according to the available data) and Abstracts Views on Vision4Press platform.
Data correspond to usage on the plateform after 2015. The current usage metrics is available 48-96 hours after online publication and is updated daily on week days.
Initial download of the metrics may take a while.