Fig. 6
Download original image
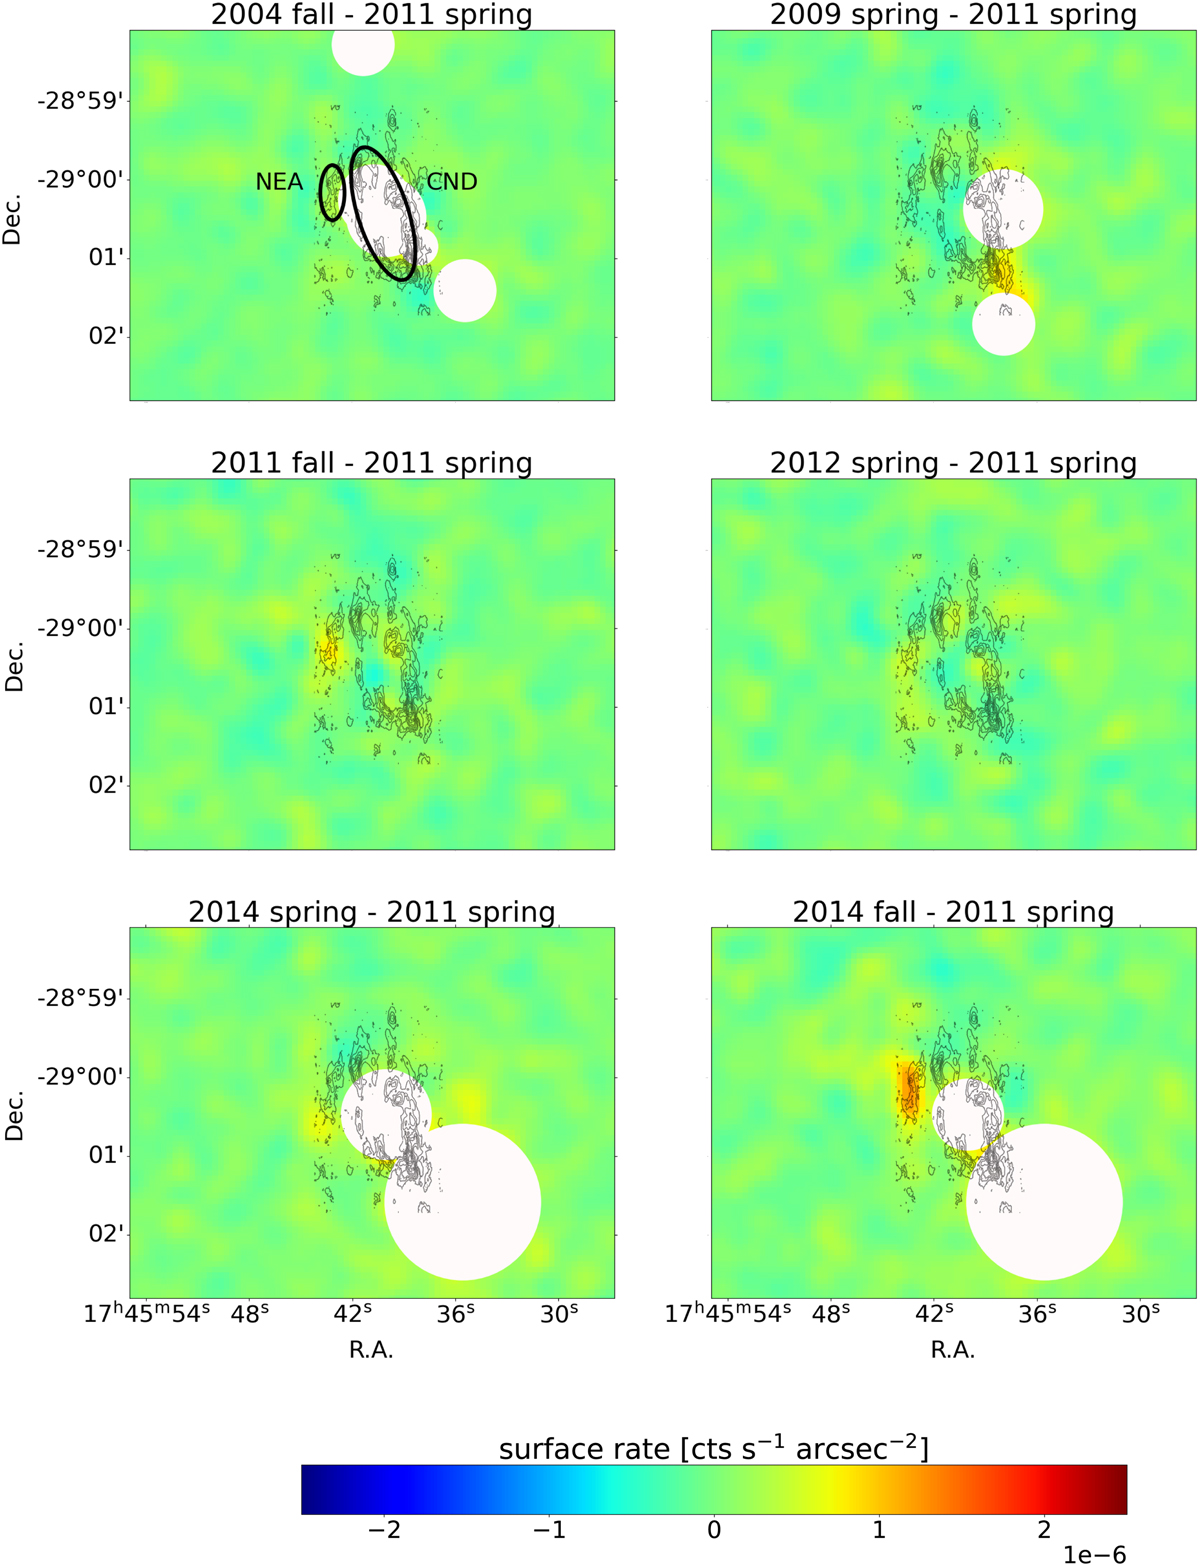
Difference between distinct datasets in the Fe Kα line band. The colorbar ranges from −2.5 ×10⁻⁶ to 2.5 ×10⁻⁶ cts s−1 arcsec−2. In the upper-left panel, the large ellipse highlights the CND and the smaller one the NEA. Countours of the CND are taken from Christopher et al. (2005). Transient point sources are masked. An increase in the Fe Kα line flux is observed in the NEA during fall 2014. The bright transient of 2004 (Porquet et al. 2005) and the magnetar prevent us from studying the CND in 2004 and 2014.
Current usage metrics show cumulative count of Article Views (full-text article views including HTML views, PDF and ePub downloads, according to the available data) and Abstracts Views on Vision4Press platform.
Data correspond to usage on the plateform after 2015. The current usage metrics is available 48-96 hours after online publication and is updated daily on week days.
Initial download of the metrics may take a while.