Fig. 14
Download original image
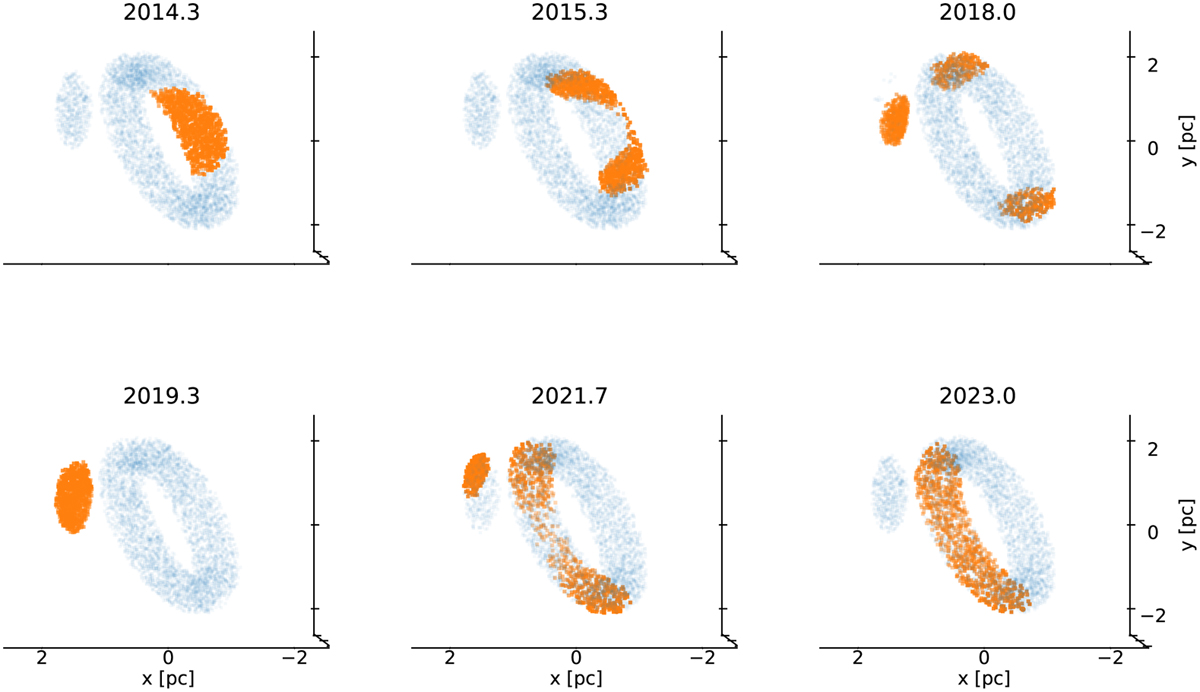
Qualitative evolution of the fluorescence signal from the CND (blue) due to the outburst of the magnetar SGR J1745–2900. The region from which a Fe Ka signal is expected is highlighted in orange. The density of the torus structure is assumed to be constant and uniform. We assume that the outburst had a one-year duration. The magnetar is assumed to be in the position (x, y, z) = (0.1, −0.1,0.0) pc. A different position along the LOS translates in different time delays. An animated version is available onlne.
Current usage metrics show cumulative count of Article Views (full-text article views including HTML views, PDF and ePub downloads, according to the available data) and Abstracts Views on Vision4Press platform.
Data correspond to usage on the plateform after 2015. The current usage metrics is available 48-96 hours after online publication and is updated daily on week days.
Initial download of the metrics may take a while.