Fig. 10
Download original image
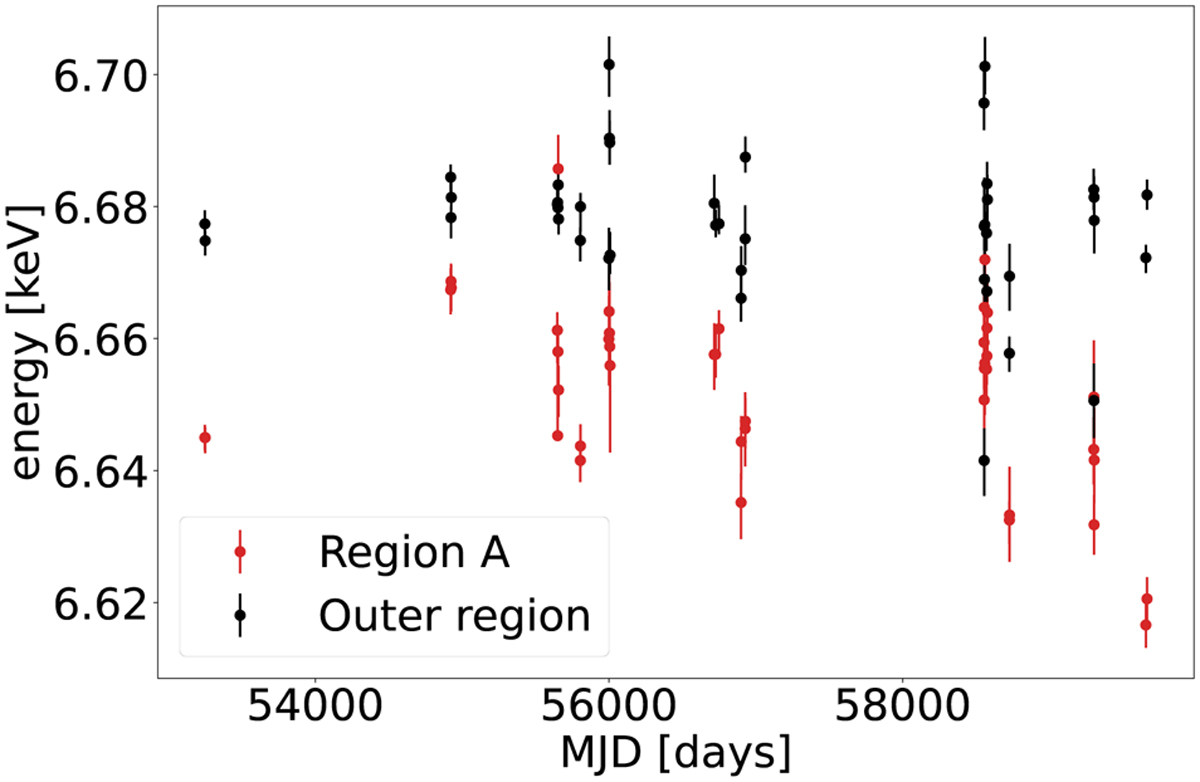
Best-fit value of the energy of the Fe XXV line in region A for the observations considered in this work (red data points). The energy is the best-fit value obtained for a power-law and Gaussian line model. The error bars refer to the associated 68% confidence interval. MJD refers to the start of the observation date. The black data points are the centroids of the Fe XXV triplet measured in the outer region and displayed in Fig. 4.
Current usage metrics show cumulative count of Article Views (full-text article views including HTML views, PDF and ePub downloads, according to the available data) and Abstracts Views on Vision4Press platform.
Data correspond to usage on the plateform after 2015. The current usage metrics is available 48-96 hours after online publication and is updated daily on week days.
Initial download of the metrics may take a while.