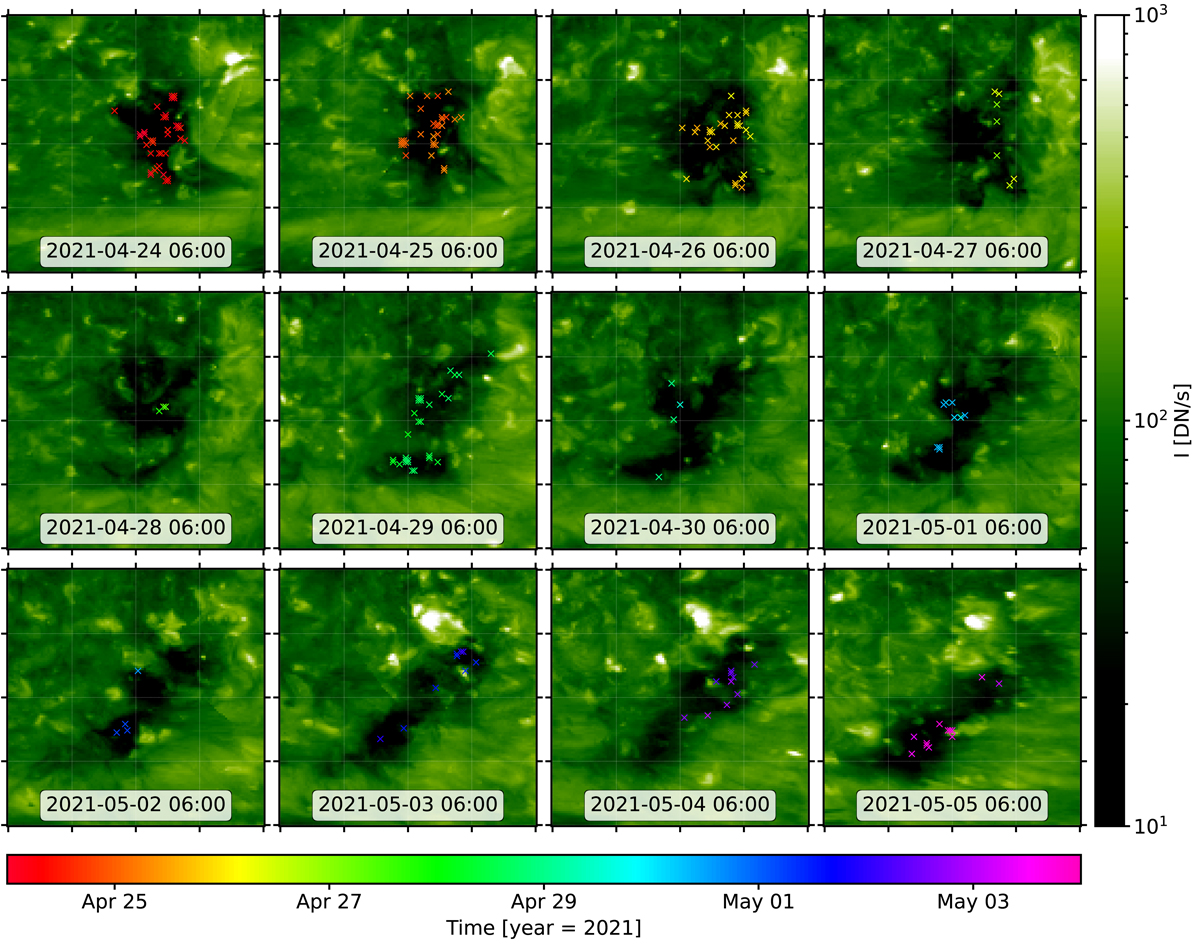
Fig. 8.
Download original image
Daily images of the evolution of the coronal hole from April 24, 2021, to May 5, 2021. The images show merged STEREO-A/EUVI 195 Å and SDO/AIA 193 Å filtergrams as prepared by the CHMAP pipeline. The coronal hole is shown in the heliographic Carrington frame on a 10° grid (white guidelines) from −50° to −10° latitude and 120°–160° longitude. In each image the locations of short-term EUV brightenings that occurred in the time period of ±12 h around the shown frame are labeled “x”. The labeled locations are color-coded according to the time of detection.
Current usage metrics show cumulative count of Article Views (full-text article views including HTML views, PDF and ePub downloads, according to the available data) and Abstracts Views on Vision4Press platform.
Data correspond to usage on the plateform after 2015. The current usage metrics is available 48-96 hours after online publication and is updated daily on week days.
Initial download of the metrics may take a while.